List of atmospheric pressure records in Europe explained
The following is a List of atmospheric pressure records in Europe and the extratropical Northern Atlantic. (It does not include localised events, such as those that occur in tornados.)
Extreme pressure values in Europe show both seasonal and geographical differentiation. The greatest pressure extremes occur in winter (January), with the deepest lows occurring to the northwest of the continent, and a diminishing influence of low pressure to the southeast towards Central Europe and Southeast Europe.[1] This is related to the main cyclonic centre of the Icelandic Low, and the North Atlantic extratropical storm track, close to which have been observed some of the lowest atmospheric pressures of the Northern Hemisphere outside the tropics. Extreme high values are favoured over the north east of Europe where intense cold and long winter nights lead to radiative cooling of the air column, causing sinking air reinforcing the development of the highest pressures. Other influences include the semi-permanent Azores High and Siberian High.[2]
Land-based observations in Europe
Land-based records for Europe:
- Highest observed air pressure record:
- 22–23 January 1907 in Pärnu, Estonia and Riga, Latvia at 1067.1 mbar reported in peer-reviewed literature.
Other high values have been reported:
- 23 January 1907 in Riga at 1068.7 hPa, this value is from a student generated report from the Free University of Berlin Adopt a Vortex scheme.[3] (supported with a 1068 hPa pressure reported in a Danish Meteorological Society publication.[4])
- 17 February 1954 in northern Russia >1060 hPa,[5] This high is claimed to have a pressure over 1070 hPa by a Free University of Berlin student generated report.[6]
- 16 February 1956, northern Urals 1070 hPa mentioned in student generated reports from FUB. 1067 hPa in another student report from FUB. Others give a figure for this high of 1065 mslp.[7] An isobar of 1072 over Russia features on the Met Office Daily Weather Report 16 February 1956 centred about the town of Vorkuta, Komi Republic.[8]
- 31 January 2012 station Khoseda-Khard directly west of Urals a value of 1068.3 hPa,[9] also reported by SMHI,[10] from a high pressure area named "Cooper/Dieter" by the Free University of Berlin in January 2012[6] which brought the Early 2012 European cold wave.
Pressure is thought to have risen above 1060 hPa in Europe on only 12 occasions between 1871 and 2010, in the years 1893, 1899, 1907, 1915, 1920, 1938, 1944, 1946, 1956, 1972, 1995 and 2008.[11] To this list might also be included high pressure anticyclones in 1954 and 2012 (see above), and 1869.[12] The most notable high in Europe peaked in January 1907. This was an unusual development that brought high pressure to the west, and holds the officially-recognised record across multiple countries from Scandinavia to Central Europe (Denmark, Norway, Sweden, Finland, Estonia, Latvia, Germany, Czechia, Slovakia, Hungary).
Another value reported:
- 6–7 January 1839, recorded at Sumburgh Head, Shetland during the Night of the big wind storm 27.25inHg this value is from non-standardised equipment, and is not fully supported by values at neighbouring stations (unknown if corrected for MSLP).[14] The conversion to hPa above assumes an Inch of mercury at 0 °F = 3376.85 Pa, if value assumes inHg at 60 °F = 3376.38 Pa the value could be as low as 920.2 hPa.
Northern Europe
Iceland
Note: Iceland is a sparsely populated country with a very limited number of weather stations compared to its area. Therefore the vast majority of extreme pressure events will not have been recorded.
- Highest air pressure: 3 January 1841, Reykjavik 1058.0 hPa.
Iceland monthly maximum figures for atmospheric pressure
Location! pressure
(hPa)! ref! class="unsortable"| Notes |
| January | 3 January 1841 | Reykjavik | 1058.0 | | Calibrated to 1058.5 in some publications.[15] |
| February | 14 February 1892 | | 1051.8 | [16] | |
| March | 6 March 1883 | Vestmannaey settlement | 1051.7 | | |
| April | 16 April 1991 | Egilsstaðir | 1050.8 | | |
| May | 18 May 1894 | Akureyri | 1045.0 | | |
| June | 11 June 2019 | Reykjavík Airport | 1040.6 | [17] [18] | Previously 21 June 1939 Stykkishólmur, 1040.4 hPa. |
| July | 3 July 1917 | Stykkishólmur | 1034.3 | | |
| August | 31 August 2021 | Önundarhorn | 1036.3 | [19] [20] | An unofficial value, 28 August 1869 Stykkishólmur, 1036.7 hPa |
| September | 28 September 1983 | Akureyri | 1038.3 | | |
| October | 26 October 2018 | Gjögur Airport | 1045.9 | [21] [22] | Previously 20 October 1885 at Akureyri and 26 October 1919 at Ísafjörður (1919): 1044.5 hPa[23] [24] |
| November | 24 November 2005 | Bolungarvík | 1048.0 | | |
| December | 16 December 1917 | Stykkishólmur | 1054.2 | | | |
Iceland list of atmospheric pressure over 1050 hPa
High pressure in Iceland has exceeded 1050 hPa on 5 recorded occasions in the 19th century, 4 recorded occasions in the 20th century and 2 in the 21st century.[25]
Location! Pressure
(hPa)! class="unsortable"| Notes |
| 23 December 1836 | Reykjavík | 1050.9 | |
| 3 January 1841 | Reykjavík | 1058.0 | |
| 11 December 1846 | Reykjavík | 1051.7 | 10 December Stykkishólmur 1052.6 hPa.[26] |
| 6 March 1883 | Stykkishólmur | 1050.7 | |
| 12 January 1890 | Akureyri | 1051.6[27] | |
| 26 February 1890 | Stykkishólmur | 1050.0 | |
| 14 January 1891 | Westman Isles | 1051.1[28] | |
| 14 February 1892 | Akureyri and Stykkishólmur | 1051.8 | |
| 16 December 1917 | Stykkishólmur | 1054.2 | |
| 26 February 1962 | Akureyri | 1051.7 | |
| 17 January 1977 | Galtarviti, Keflavík | 1051.1 | |
| 14–15 April 1991 | Several stations | 1050 | |
| 25–26 February 2006 | Several stations | 1050 | |
| 28 March 2020 | Hjarðarland | 1050.5 [29] [30] | named "Keywan" by FUB. | |
Climatic Research Unit Emulate data 1874–2002, also gives values on 10 March 1887 at Stykkishólmur 1052.43 hPa and also 9 January 1977 at the same location 1050.47 hPa.[31]
Iceland monthly minimum figures for atmospheric pressure
Monthly minimum figures for atmospheric pressure in Iceland | Month | Date | Location | pressure hPa | ref | Notes |
|---|
| January | 3 January 1933 | Westman Isles | 923.9 | | |
| February | 4 February 1824 | Reykjavik | 923.8 | [32] | |
| March | 4 March 1913 | Reykjavik | 934.6 | [33] |
| April | 11 April 1990 | Bergstöðum in Skagafjörður | 951.0 | [34] | |
| May | 13 May 1956 | Stórhöfði | 967.3 | [35] | |
| June | 11 June 1983 | Stórhöfði | 959.6 | [36] | 958.0 offshore low.[37] |
| July | 22 July 2012 | Westman Isles | 972.4 | [38] | |
| August | 27 August 1927 | Hólar in Hornafjörður | 960.9 | [39] | |
| September | 13 September 1906 | SW Iceland | ~942 | [40] |
|
| October | 19 October 1963 | Stórhöfði | 938.4 | [41] | |
| December | 2 December 1929 | Stórhöfði | 920 | | | |
In July the pressure in Iceland has only dropped below 975 hPa or lower three times over the entire record extending back to the 1820s. These cases were 974.1 hPa in Stykkishólmur on 18 July 1901, 974.3 hPa in Stykkishólmur on 19 July 1923 and 975.0 hPa in Reykjavík 11 July 1912.[42] —to which can be added 22 July 2012, with 972.4 hPa reported on the Westman Isles, becoming the new national record for the month.[43] [44]
A recent low pressure on 30 December 2015 was recorded at Kirkjubaejarklaustur (associated with an area of low pressure known as Eckard/Frank) at 930.2 hPa, the lowest pressure recorded on land in Iceland since 1989.[45]
Faroe Islands
The Danish Meteorological Institute report record atmospheric pressure for the Faroe Islands (since 1961) as:
Climatic Research Unit Emulate data 1874–2002 give 3 dates when pressure exceeded 1050 hPa in Tórshavn.[47]
Table of atmospheric pressure in Tórshavn exceeding 1050 hPa.| Date | pressure hPa |
|---|
| 8 January 1896 | 1052.64 |
| 1 February 1902 | 1052.43 |
| 21 February 1944 | 1050.33 | |
Ireland
Met Éireann list the following national records for atmospheric pressure:
- Highest air pressure: 28 January 1905, Valentia Island, Co.Kerry 1051.9 hPa.
- Lowest air pressure: 28 November 1838, Limerick 931.2 hPa.
Ireland monthly maximum figures for atmospheric pressure
Location! pressure hPa! class="unsortable"| Notes |
| January | 28 January 1905 | Valentia, Co. Kerry | 1051.9 | |
| February | 7 February 1964 | Kilkenny and Mullingar | 1049.1 | |
| March | 29 March 2020 | Malin Head | 1051.2 [48] [49] | - Previously: 13 March 1900, Valentia 1047.1.
|
| April | 26 April 1948 | Shannon Airport | 1043.4 | |
| May | 12 May 2012 | Cork Airport | 1042.4 | An alternate value on 12 May 2012 at Valentia observatory of 1043.0 hPa has also been reported.[50] |
| June | 14 June 1959 | Clones, Co Monaghan | 1043.1 | |
| July | 1 July 1933 | Malin Head | 1037.9 | |
| August | 17 August 1940 | Valentia | 1036.0 | |
| September | 10 and 11 September 2009[51]
24 September 2018 | Malin Head
Sherkin Island and Cork Airport[52] | 1041.3 | |
| October | 22 October 2018 | Sherkin Island | 1043.8 | - Previously 31 October 1959 Malin Head 1043.0
|
| November | 10 November 1999 | Knock Airport | 1046.0 | |
| December | 24 December 1926 | Malin Head | 1049.5 | | |
Ireland monthly minimum figures for atmospheric pressure
Monthly minimum figures for atmospheric pressure in Ireland Met Éireann.[53] | Month | Date | Location | pressure hPa | Notes |
|---|
| January | 26 January 1884 | Markree Castle, Sligo | 936.6 | |
| February | 4 February 1951 | Midleton, Co. Cork | 942.3 | |
| March | 10 March 2008 | Mace Head, Galway | 950.0 | (named Johanna by FUB)[54] |
| April | 1 April 1948 | Malin Head, Co. Donegal | 952.9 | |
| May | 10 May 1983 | Belmullet, Co. Mayo | 970.3 | |
| June | 8 June 1843 | Phoenix Park, Dublin | 975.3 | |
| July | 25 July 1988 | Belmullet, Co. Mayo | 978.0 | |
| August | 20 August 2020 | Athenry, Galway | 966.4[55] [56] | (Storm Ellen) *Previously 14 August 1959 Belmullet, Co. Mayo 967.8 |
| September | 21 September 1953 | Claremorris, Co. Mayo | 957.1 | |
| October | 28 October 2004 | Valentia | 957.5 | (named Carolin by FUB)[57] |
| November | 28 November 1838 | Limerick | 931.2 | |
| December | 17 December 1989 | Cork Airport | 942.8 | | |
Isle of Man
1957–2005
- Highest air pressure: 26 January 1992, Ronaldsway 1047.8 hPa.
- Lowest air pressure: 1 December 1966, Ronaldsway 946.5 hPa.
An earlier value on 8 December 1886, Cronkbourne 27.555inHg.[58]
United Kingdom
For the United Kingdom, the Met Office record the record figures for atmospheric pressure (which are nominally since 1870) as:
- Highest air pressure: 31 January 1902, Aberdeen Scotland 1053.6 hPa.
- Lowest air pressure: 26 January 1884, Ochtertyre Scotland 925.6 hPa.
Though the lowest pressure may be second to the Night of the big wind low, which saw a value of 27.25inHg at Sumburgh Head, Shetland on non-calibrated, non-standard equipment 6–7 January 1839, with the mainland at Cape Wrath reporting an observed pressure of 27.32inHg.
On 26 January 1884, during the Ochtertyre storm the Ben Nevis summit weather station recorded a low pressure of 784.7 hPa (at high altitude (above 750 m) and not reduced to sea level) this is proposed as being almost certainly the lowest surface pressure ever recorded in the UK,[59] though due to altitude and not being a value reduced to sea level is not considered comparable to the other records presented here.
A low pressure of 914.0mb affected the UK during the Braer Storm on 10 January 1993, however this figure is discounted as this reading was not recorded in the UK.
United Kingdom monthly maximum figures for atmospheric pressure
Monthly maximum figures for atmospheric pressure UK and Ireland Met Office.[60] | Month | Date | Location | pressure hPa | Alternative and UK only records |
|---|
| January | 31 January 1902 | Aberdeen Observatory, Aberdeenshire | 1053.6† | |
| February | 1 February 1902 | Aberdeen Observatory, Aberdeenshire | 1052.9 | |
| March | 29 March 2020 | South Uist, Outer Hebrides | 1051.2 [61] | Previously 3 March 1990 St Mary's Airport, Isles of Scilly 1047.9 hPa.[62] The value from 9 March 1953 Tynemouth of 1048.6 is thought to be from an erroneous value transcription of 1043.6.[63] [64] |
| April | 11 April 1938 | Eskdalemuir, Dumfriesshire | 1044.5 | |
| May | 16 May 1943 | Dublin Airport, Ireland | 1042.2 | UK value: 1881, Aberdeen, Glasgow and Armagh 1042 hPa.[65] |
| June | 14 June 1959 | Clones Co. Monaghan | 1043.1 | UK value: 14 June 1959, "Northern Ireland" 1043 hPa (Irish record is within 1 km of UK border). 15 June 1874 Scotland >1040 hPa.[66] |
| July | 16 July 1996 | Aboyne, Aberdeenshire | 1039.2 | |
| August | 31 August 2021 | Stornoway, Isle of Lewis | 1038.5[67] [68] | Previously Kirkwall, Orkney 25 August 1968 1037.4. |
| September | 11 September 2009 | Ballykelly, Co. Londonderry | 1042.0 | - Previously 19 September 1986 Shawbury, Shropshire 1041.2 hPa.
|
| October | 31 October 1956 | Dyce, Aberdeenshire | 1045.6 | |
| November | 10 November 1999 | Aviemore, Invernessshire | 1046.7 | |
| December | 24 December 1926 | Wick, Caithness | 1051.9 | | |
(† note the value of 1054.7 reported in some literature is an incorrect conversion.
[69])
United Kingdom list of atmospheric pressure over 1050 hPa
List of atmospheric pressures over 1050 hPa in UK and Ireland[70] (likely incomplete)| Date | Location | pressure hPa |
|---|
| 24 February 1808 | Gordon Castle, Moray Scotland | 1050.0 |
| 8–9 January 1820 | Kinfauns Castle, Perth Scotland | 1051.7 |
| 9 January 1896 | Ochtertyre, Perth Scotland | 1053.4 |
| 31 January 1902 | Aberdeen, Scotland (UK record) | 1053.6 |
| 28 January 1905 | Falmouth, Cornwall | 1053.1 |
| 23 January 1907 | Aberdeen, Scotland | 1051.8 |
| 24 December 1926 | Wick, Scotland | 1051.9 |
| 26 January 1932 | Stonyhurst, Sheffield and Meltham, West Yorkshire | 1051.0 |
| 16 January 1957 | Belmullet, Co Mayo Ireland and Benbecula, Scotland | 1050.9 |
| 19 January 2020 | Mumbles Head, Wales.[71] | 1050.5 |
| 29 March 2020 | South Uist, Scotland. | 1051.2 | |
In the period of instrumental measurement the atmospheric pressure has exceeded 1048 hPa somewhere over the United Kingdom and Ireland on 18 occasions. On 10 of these times, the pressure exceeded 1050 hPa. Intense high pressure is usually seen during midwinter with eight of the 10 occasions where 1050 hPa has been exceeded occurring in January.
Pressure values have been recorded to have exceeded 1050 hPa in all areas of the UK and Ireland except south east England, though values close to this are documented from January 1882 and January 1905. To which high pressure in January 2020 saw a value of 1049.6 at Heathrow Airport measured, which is thought to be likely the highest pressure seen in the region with records back to 1692.[72] [73] [74]
United Kingdom and Ireland monthly minimum figures for atmospheric pressure
Location! pressure
(hPa)! class="unsortable"| Alternative and UK only records |
| January | 26 January 1884 | Ochtertyre, Perthshire | 925.6 | Alternative: 6–7 January 1839, Sumburgh Head, Shetland during the Night of the big wind storm 27.25inHg, (value from non-standardised equipment). |
| February | 4 February 1951 | Midleton, Co. Cork | 942.3 | UK value: 9 February 1988, Benbecula 944.0 hPa. |
| March | 9 March 1876 | Wick, Caithness | 946.2 | |
| April | 1 April 1948 | Malin Head, Co. Donegal | 952.9 | UK value: 1 April 1948, The Hebrides 953 hPa. |
| May | 8 May 1943 | Sealand, Flintshire (listed as Cheshire) | 968.0 | |
| June | 28 June 1938 | Lerwick, Shetland | 968.4 | |
| July | 8 July 1964 | Sule Skerry, Northern Isles | 967.9 | |
| August | 14 August 1954 | Belmullet, Co. Mayo | 967.7 | UK value: 30 August 1992, NE Scotland ~972 hPa.[75] [76] |
| September | 21 September 1953 | Claremorris, Co. Mayo | 957.1 | UK value: 16–17 September 1935, "Central England" 960 hPa. |
| October | 14 October 1891 | Cawdor Castle, Highland (listed as Nairnshire) | 946.8 |
|
| November | 11 November 1877 | Monach Lighthouse, Outer Hebrides | 939.7 | The England and Wales record is 953.3 hPa from Plymouth on 2 November 2023 during storm Ciarán, previously 959.7 hPa from 1916.[77] [78] |
| December | 8 December 1886 | Belfast, Antrim | 927.2 | On the morning of 8 December 1886, the barometer may have fallen as low as 924 hPa over Northern Ireland, although the lowest authenticated value was 927.2 hPa at Belfast at 1330h, close to the centre of the depression.[79] | |
Cyclone Oratia is estimated to have reached a low of 941 hPa in peer-reviewed literature, though the lowest pressure occurred between Aberdeen and Norway over the North Sea and is not a land-based observation. The lowest land-based reported UK pressure during this storm, of 951.2 hPa, was recorded at RAF Fylingdales.[80]
On 7 September 1995, Scilly Isles, reported a low pressure of 966 hPa.[81] The lowest minimum recorded values for the months May to August lie within 0.5 of 968 hPa.
The 20th century low pressure record in the UK occurred on 20 December 1982 at Sule Skerry: it may have dropped as low as 936 hPa.[82]
United Kingdom list of atmospheric pressure below 950 hPa (incomplete)
- 1821 December 25, London 27.93inHg.[83]
- 1839 January 7, Night of the big wind, pressure below 28inHg at Inchkeith, Peterhead and Aberdeen.
- 1865 November 22,
- 1865 December 31, Butt of Lewis Lighthouse 27.69inHg, with a report of 27.63inHg from Hoy that is not supported by observation from Cantick head lighthouse on South Walls.
- 1884 January 26, Ochtertyre, record lowest pressure value for the UK.
- 1886 December 8,
- 1982 December 20, Stornoway 937.6 hPa.[82]
- 1989 February 25, Portland, Dorset 948.8.
- 2013 December 24, Cyclone Dirk, Stornoway 936.8 hPa.[84]
- 2020 February 9 Storm Ciara, Kirkwall Airport 945 hPa.[85]
Home nation records
Based on Burt (2007) and Met Office.
Scotland
Same as UK national records.
- Highest: 31 January 1902, Aberdeen Observatory 1053.6 hPa.
- Lowest: 26 January 1884, Ochtertyre Scotland 925.6 hPa.
Northern Ireland
- High: 29 March 2020, The Northern Irish north coast likely saw a value in the region of ~1051 hPa around Magilligan Point.
29 March 2020, Belfast Aldergrove 1049.8 hPa.[63]
- Lowest: 8 December 1886, in Belfast 927.2 hPa. (A reading of 922.5 mbar (corrected to MSL) was reported from Omagh in Co. Tyrone (Harding 1887) the graduation and calibration of the barometer were not considered satisfactory enough “to quote the reading as trustworthy”, the storm minimum over the Northern Ireland was thought to be close to 924 mbar.)
Wales
- Highest: 19 January 2020, Mumbles Head, West Glamorgan 1050.5 hPa.
Previously: 28 January 1905, Pembroke, 1050.1 hPa.[72]
- Lowest: 22 November 1865, Dolgellau, North Wales 944.8 hPa.
England
- Highest: 28 January 1905, Falmouth, Cornwall 31.097inHg.[86]
- Lowest: 8 December 1886, Stonyhurst in Lancashire, where the barometer fell to 940.4 hPa.
Alt. 8 December 1886, Newton Reigny in Cumbria, 27.556inHg.[58]
Norway
Yr.no the joint venture between the Norwegian Broadcasting Corporation and the Norwegian Meteorological Institute give the national pressure records as:
(formerly listed as 27 January 1907, Bergen 936 hPa.)[89] [90]
A value of 702.0 mm Hg at Bergen Lungegård Hospital on January 27, 1884 (935.8 hPa) is also reported,[91] [92] which is likely to be from the same low as the UK record from Ochtertyre the previous day. Other sources give a pressure value of 939.8 hPa or 939.7 hPa in Bergen on 27 January 1884.[93] [94] [95]
Both records in same winter as each other and those of Denmark.
Monthly maximum figures for atmospheric pressure Norway| Month | Date | Location | pressure hPa | ref | Notes |
|---|
| February | 28 February 2018 | Tynset, Hedmark | 1061.0 | [96] |
| October | 5 October 2016 | Otta | 1054.3 | [97] [98] | - Previously 14 October 1896, Dalen, Telemark, 1044.0 hPa.[99]
| |
Norway uses a different formula for correction of air pressure to sea level than Sweden. This affects the result for high altitude stations in cold weather.[96]
Denmark
The Danish Meteorological Institute report record barometric pressure for Denmark (since 1874) as:
- Lowest air pressure: 20 February 1907, Skagen 943.5 hPa.[100]
Danish records both occurred within a month during the same winter, and same winter as Norwegian records.[102]
Denmark monthly maximum figures for atmospheric pressure
Monthly maximum figures for atmospheric pressure Denmark (Italic text based on 1961–1990 data only[103])| Month | Date | Location | pressure hPa | ref | Notes |
|---|
| January | 23 January 1907 | Skagen and Copenhagen | 1062.2 | | |
| February | 7 February 2012 | Thyborøn | 1050.3 | [104] | 2012 value exceeds 1961–1990 maximum. |
| March | 19 March 2022 | Tirstrup | 1051.6 tbc. | [105] | 12 March 1880, Hammer Odde 1049.4 hPa.[106] |
| April | 16 April 1962 | Skagen | 1040.6 | | |
| May | 3 May 1990 | Christiansø Lighthouse | 1041.6 | | |
| June | 7 June 1962 | Skagen | 1038.8 | | |
| July | 16 July 1972 | Christiansø Lighthouse | 1031.9 | | |
| August | 18 August 1966 | Christiansø Lighthouse | 1032.8 | | |
| September | 29 September 2015 | Østerbro | 1042.2 | [107] [108] | - Previously 18 September 1904, Hammer Odde Lighthouse 1038.8 hPa. (or 29 September 1970, Bornholm Airport 1040.0 hPa)
|
| October | 5 October 2016 | Skagen | 1045.5 | [109] [110] | - Previously 6 October 1877, Hammer Odde Lighthouse 1044.7 hPa.
|
| November | 18 November 1985 | Skagen | 1052.4 | | |
| December | 24 December 1962 | Fornæs Lighthouse and Værløse Air Base | 1051.6 | | | |
Denmark list of barometric pressure over 1050 hPa
Above 1050 hPa| Date | Location | pressure hPa | Notes |
|---|
| 19 March 2022 | | | |
| 7 February 2012 | Thyborøn | 1050.3 | 8 February 2012 North Jutland >1050 hPa.[111] |
| 18 November 1985[112] | Thyborøn | 1050.3 | or 1052.5 Skagen. |
| 1962 | Denmark | 1052 | |
| 23 January 1907 | Skagen | 1062.2 | |
| 31 January—1 February 1902 | Skagen and Fanø | 1050 | [113] 1056.1 [114] | |
Denmark monthly minimum figures for atmospheric pressure
Monthly minimum figures for atmospheric pressure Denmark (Italic text based on 1961–1990 data only)| Month | Date | Location | pressure hPa | ref | Notes |
|---|
| January | 14 January 1984 | Skagen | 950.2 | | |
| February | 20 February 1907 | Skagen | 943.9 | | |
| March | 25 March 1986 | Skrydstrup Airport | 961.4 | | 18 March 2007 Skagen 958.6 hPa.[115] |
| April | 21 April 1967 | Skagen | 975.7 | | April 1876, 966.0 [116] [117] |
| May | 28 May 1972 | Thyborøn | 985.1 | | 6 May 1997 Skagen 981.3 hPa.[118] |
| June | 6 June 1977 | Skagen | 985.1 | | |
| July | 30 July 1965 | Skagen | 982.5 | | |
| August | 6 August 1985 | Thyborøn | 980.1 | | |
| September | 22 September 1990 | Thyborøn | 970.1 | | |
| October | 18 October 1967 | Tirstrup | 966.7 | | During the passage of the October storm (Lena) |
| November | 6 November 1985 | Aalborg Airport | 953.0 | | |
| December | 10 December 1965 | Thyborøn | 955.2 | | Cyclone Anatol 3 December 1999 saw a pressure over Denmark of ~951 hPa.[119] | |
Sweden
The Swedish Meteorological and Hydrological Institute give the nation's barometric records as:
- Lowest air pressure: 6 December 1895 Härnösand 938.4 hPa.
Sweden monthly maximum figures for atmospheric pressure
Sweden monthly minimum figures for atmospheric pressure
Finland
According to the Finnish Meteorological Institute:
- Lowest air pressure: 27 February 1990 Kuuskajaskari, Rauma 940 hPa.
Though a reported low value by Weather Underground weather historian Christopher Burt on 1 March 1990 at an unknown location is reported at 939.7 hPa.[154] Helsingin Sanomat report a value at Turku Airport on 28 February 1990 of 939.8 hPa, with the previous record reported as being from 16 December 1982 on Moikpää, in the Kvarken at 942.1 hPa.[155]
Baltics
Maximum pressure in Europe 22–23 January 1907 recorded in Pärnu, Estonia and Riga, Latvia at 1067.1 mbar.[70] The Free University of Berlin state the European air pressure record is 23 January 1907 in Riga at 1068.7 hPa.[3]
Estonia
As reported by the Estonian Weather Service
- Highest air pressure: 23 January 1907, Tallinn 1060.3 hPa.‡
Alt: 21 November 1993, Narva 1057.2 hPa.
- Lowest air pressure: 16 December 1982, Naissaar 947.6 hPa.
16 December 1982 Väike-Maarja 936.0 hPa is a station level value.[156]
‡The Estonian Weather Service report on their website the record maximum observed air pressure in the country as 1060.3 hPa recorded 23 January 1907 in Tallinn.[157] This figure is not supported by NOAA reanalysis charts[158] and the values reported from neighbouring Finland and Latvia probably make this figure an underestimation or error. A possible maximum pressure value for the whole of Europe is thought to have occurred during the 22–23 January 1907 high pressure event with a record set in Pärnu, Estonia and Riga, Latvia at 1067.1 mbar.[70] Though this value is exceeded by the value on 23 January 1907 in Riga reported at 1068.7 hPa by the Free University of Berlin's student generated reports,[3] at which time the pressure is estimated to have reached around 1070 hPa by Yr.no in the Gulf of Riga.[159]
Monthly maximum figures for atmospheric pressure Estonia 2004–Present, based on hourly station observations.| Month | Date | Location | pressure hPa | ref | Notes |
|---|
| January | 22 January 2006 | Kuusiku | 1058.1 | [160] | January 1907 |
| February | 1 February 2012 | Narva-Jõesuu | 1053.4 | [161] | |
| March | 16 March 2015 | Jõhvi | 1052.7 | [162] | |
| April | 2 April 2004 | Kihnu | 1037.9 | [163] | |
| May | 6 May 2006 | Kunda | 1039.0 | [164] | |
| June | 1 June 2009 | Lääne-Nigula | 1037.5 | [165] | |
| July | 2 July 2006 | Võru | 1033.6 | [166] | |
| August | 21 August 2015 | Lääne-Nigula | 1032.3 | [167] | |
| September | 28 September 2018 | Jõhvi | 1043.9 | [168] | |
| October | 31 October 2015 | Võru | 1041.6 | [169] | |
| November | 16 November 2018 | Valga | 1043.2 | [170] | 21 November 1993 Narva 1057.2. |
| December | 30 December 2015 | Valga | 1048.0 | [171] | | |
Monthly minimum figures for atmospheric pressure Estonia 2004–Present, based on hourly station observations.| Month | Date | Location | pressure hPa | ref | Notes |
|---|
| January | 11 January 2005 | Ristna | 962.6 | | |
| February | 17 February 2022 | Vilsandi | 959.6 | | |
| March | 26 March 2008 | Narva-Jõesuu | 966.6 | | |
| April | 5 April 2022 | Pakri | 965.8 | | |
| May | 2 May 2019 | Kunda | 977.1 | | |
| June | 27 June 2007 | Ristna | 981.7 | | |
| July | 9 July 2009 | Ristna | 986.6 | | |
| August | 10 August 2005 | Kihnu | 985.0 | | |
| September | 14 September 2017 | Vilsandi | 981.4 | | |
| October | 21 October 2021 | Vilsandi | 966.7 | | |
| November | 23 November 2008 | Tiirikoja | 951.3 | | |
| December | 6 December 2013 | Vilsandi | 966.1 | | 16 December 1982, Naissaar 947.6 hPa | |
Latvia
- Highest air pressure: 22–23 January 1907 Liepāja 1065.9 hPa
In the period 1960 to 2014, 16 December 1997 Daugavpils a value of 1055.8 hPa recorded.[172]
- Low air pressure: 13 February 1962 Vidzeme Upland 932.9 hPa (probably a station level reading).
Lithuania
- Highest air pressure: December 1889 Vilnius 1058.5 hPa
23 January 1907 1065.1 hPa.[11] Deutsche Seewarte gives morning readings on 23 January 1907 in Klaipeda (Memel) of 799mmHg and in Vilnius (Wilna) of 798.9mmHg. There is a mention in the Hungarian meteorological journal Időjarás of reaching 800mmHg in Vilnius (Wilna) during the exceptional January 1907 anticyclone, but in the other place the Vilnius value of 799.4mmHg is reported. According to an article in the German-Austrian expert journal Meteorologische Zeitschrift, on 23 January 1907 at 7 hrs Vilnius (Wilna) reached 799.2mmHg.
Kaliningrad/Königsberg
- Highest air pressure: 23 January 1907 1064.7 hPa[11]
Western Europe
Channel Islands
Jersey
1862–present
- Highest air pressure: 29 January 1905, Jersey 1051.7 hPa.[70]
- Lowest air pressure: 25 February 1989, Jersey 953.8 hPa.[173]
Guernsey
Guernsey Airport 1960–present.[70]
- Highest air pressure: 20 January 2020, 1049.1 hPa.[174]
Formerly 3 March 1990, 1047.7 hPa.
- Lowest air pressure: 25 February 1989, 952.5 hPa.
Alderney
- Highest air pressure 20 January 2020, 1049.8 hPa.[174]
France
Météo-France figures from 1951–present.[175]
Previously: 3 March 1990, Pointe de Chémoulin, Saint-Nazaire Loire-Atlantique 1048.9 hPa.[178]
though other listed figures predate Météo-France's records.
On 28 January 1905 values of 31.04inHg in Biarritz, and 31.01inHg in Brest are listed in the Met Office Daily Weather Report.[180] On the 29 January 1905, the atmospheric pressure reached a value of 1049.3 hPa in Paris.[181] [182]
Monthly maximum figures for atmospheric pressure France| Month | Date | Location | pressure hPa | ref | Notes |
|---|
| January | 20 January 2020 | Abbeville | 1049.7 | | |
| February | | | | | - Possible 20th Century: February 15, 1934 Cap De La Hague 1,048.2 hPa.[183]
|
| March | 3 March 1990 | Pointe de Chémoulin, Saint-Nazaire Loire-Atlantique | 1048.9 hPa | | |
| May | 13 May 2019 | Dunkirk | 1040.7 | [184] [185] | |
| September | 25 September 2018 | Valenciennes | 1040.0 | [186] | - Previously 19 September 1986 Dunkirk 1038.4 [187]
| |
Monthly minimum figures for atmospheric pressure France| Month | Date | Location | pressure hPa | ref | Notes |
|---|
| May | 5 May 2004 | Cap de la Hague | 980.1 | [188] | |
| October | | | | | 16 October 1987 Ushant 948 hPa.[189] | |
Belgium
The Belgian Royal Meteorological Institute gives the national record values as:
- Highest air pressure: 20 January 2020, Uccle 1048.3 hPa.[190]
Previously: 27 January 1932, Uccle 1048 hPa.[191]
Monthly maximum figures for atmospheric pressure Belgium (since 20 century)| Month | Date | Location | pressure hPa | ref | Notes |
|---|
| January | 20 January 2020 | Uccle | 1048.3 | |
| May | 16 May 1943 | Uccle | 1039.5 | [192] |
| June | 6 June 1962 | Uccle | 1034.9 | [193] |
| September | 27 September 1906 | Uccle | 1037.9 | |
| October | 23 October 1958 | Uccle | 1039.5 | | |
Monthly minimum figures for atmospheric pressure Belgium (since 20 century)| Month | Date | Location | pressure hPa | ref | Notes |
|---|
| February | 25 February 1989 | Uccle | 956.8 | | - Alt On 25 February 1989 a value reported at Blankenberge of 954 hPa.
|
| August | 24 August 1956 | Uccle | 980 | | |
| September | 11 September 1903 | Uccle | 976.8 | | |
| October | 10 October 1964 | Uccle | 971.0 | | |
| November | 29 November 1965 | Uccle | 967 | | | |
Luxembourg
Previously:27–28 December 2016, MeteoLux recorded the highest atmospheric pressures observed at the Luxembourg Findel Airport weather station since measurement began in 1947, a value of 1047.2 hPa was recorded twice (under the high pressure Yörn. The previous record to this was from February 15–16, 1959 at 1046.6 hPa.[195]
- Lowest pressure: February 1989 Luxembourg Findel Airport, 959.8.
Monthly maximum figures for atmospheric pressure Luxembourg (since 1947).| Month | Date | Location | pressure hPa | ref | Notes |
|---|
| January | 20 January 2020 | Luxembourg Findel Airport | 1048.0 | | Previously 1989 1045.5 hPa.[196] |
| February | February 1959 | Luxembourg Findel Airport | 1046.6 | [197] | |
| March | March 1990 | Luxembourg Findel Airport | 1045.8 | [198] | |
| April | April 1947 | Luxembourg Findel Airport | 1039.9 | [199] | |
| May | 13 May 2019 | Luxembourg Findel Airport | 1037.5 | [200] | |
| June | June 2005 | Luxembourg Findel Airport | 1036.3 | [201] | |
| July | July 1969 | Luxembourg Findel Airport | 1031.2 | [202] | |
| August | August 1949 | Luxembourg Findel Airport | 1033.5 | [203] | |
| September | 25 September 2018 | Luxembourg Findel Airport | 1039.3 | [204] | |
| October | October 1983 | Luxembourg Findel Airport | 1040.0 | [205] | |
| November | November 2001 | Luxembourg Findel Airport | 1042.1 | [206] | |
| December | 27–28 December 2016 | Luxembourg Findel Airport | 1047.2 | | Previously 1991 1044.0 hPa.[207] | |
Monthly minimum figures for atmospheric pressure Luxembourg (since 1947).| Month | Date | Location | pressure hPa | ref | Notes |
|---|
| January | January 2009 | Luxembourg Findel Airport | 967.6 | [208] | |
| February | February 1989 | Luxembourg Findel Airport | 959.8 | | |
| March | March 1994 | Luxembourg Findel Airport | 968.6 | | |
| April | April 1962 | Luxembourg Findel Airport | 984.2 | | |
| May | May 2009 | Luxembourg Findel Airport | 983.2 | [209] | |
| June | June 2009 | Luxembourg Findel Airport | 988.8 | | |
| July | July 1987 | Luxembourg Findel Airport | 993.7 | | |
| August | August 2008 | Luxembourg Findel Airport | 979.7 | | |
| September | September 1974 | Luxembourg Findel Airport | 988.5 | [210] | |
| October | October 1990 | Luxembourg Findel Airport | 979.8 | | |
| November | November 1965 | Luxembourg Findel Airport | 974.6 | | |
| December | December 1976 | Luxembourg Findel Airport | 966.5 | [211] | | |
Netherlands
The Dutch Royal Netherlands Meteorological Institute lists the following as national records:
- weergegevens.nl give a value on 23 January 1907 at Eelde of 1053.0 hPa.[214]
Netherlands monthly maximum figures for atmospheric pressure
Monthly maximum figures for atmospheric pressure Netherlands based on KNMI hourly observations.| Month | Date | Location | pressure hPa | ref | Notes |
|---|
| January | 23 January 1907 | Eelde | 1053.0 | [215] |
|
| February | 16 February 2008 | Eelde | 1048.1 | [217] |
|
| March | 6 March 1852 | Utrecht | 1046.9 | [219] | |
| April | 10 April 1938 | Vlissingen | 1041.6 | [220] | |
| May | 13 May 2019 | Vlieland | 1041.9 | [221] | - Previously 16 May 1943 Eelde, De Bilt and De Kooy 1040.2 hPa
|
| June | 6–7 June 1962 | De Kooy | 1038.3 | [222] | Alt. 7 June 1962 unknown location 1036.9. |
| July | 8 July 2013 and 10 July 1911 | Hoorn and De Kooy | 1034.6 | [223] | |
| August | 13 August 1949 | Maastricht | 1034.1 | [224] | |
| September | 25 September 2018 | Maastricht | 1040.2 | [225] | Previously:29 September 2015 Hoorn 1039.8 hPa. |
| October | 22 October 1983 | Rotterdam and Soesterberg | 1041.7 | [226] | |
| November | 20 November 1915 | Eelde | 1044.7 | [227] | |
| December | 23 December 1962 | Eelde | 1050.2 | [228] | | |
Netherlands monthly minimum figures for atmospheric pressure
Monthly minimum figures for atmospheric pressure Netherlands| Month | Date | Location | pressure hPa | ref | Notes |
|---|
| January | 23 January 2009 | Hook of Holland | 961.0 | [229] | |
| February | 25 February 1989 | Vlissingen | 954.4 | | |
| March | 24 March 1986 | Leeuwarden | 963.5 | | |
| April | 1 April 1994 | De Kooy | 972.6 | | |
| May | 5 May 2000 | De Bilt | 983.5 | [230] |
|
| June | 27 June 1958 | Vlissingen | 988.0 | | |
| July | 10 July 2000 | De Bilt | 987.5 | [231] | - Alt: 10 July 2000, Hoorn (Terschelling) 984.0 hPa.
|
| August | 27 August 1912 | De Bilt | 973.0 | | |
| September | 24 September 1927 | De Kooy | 974.8 | | |
| October | 27 October 1959 | De Kooy | 968.8 | | |
| November | 27 November 1983 | Eelde, Drenthe | 954.2 | | |
| December | 10 December 1965 | Leeuwarden | 961.5 | | | |
Germany
The German weather service (DWD) give the
Other record figures and locations are also presented:
- 23 January 1907 Dahlem (Berlin) 1057.8 hPa.[234] [235] It is claimed this is an incorrect correction to mslp and correct value is 1056.7 hPa.[236] (neither figure is higher than the DWD value)
Germany monthly maximum figures for atmospheric pressure
Monthly maximum figures for atmospheric pressure Germany based on DWD CDC hourly station observations of air pressure at mean sea level, 1949–Present.[237] (tentative)| Month | Date | Location | pressure hPa | Altitude (m) | ref | Notes |
|---|
| January | 23 January 1907 | Greifswald, Mecklenburg-Vorpommern | 1060.8 | | | National record. |
| February | 15 February 1959 | Mühldorf, Bavaria | 1050 | 405.6 | | |
| March | 19 March 2022 | Kiel lighthouse | 1049.5 | | [238] | Previously 4 March 1990 Garmisch Partenkirchen, Bavaria 1048.5. |
| April | 21 April 2002 | Greifswalder Oie, Mecklenburg-Vorpommern | 1039.3 | 12 | | Based on Berlin record, Berlin only value 1040.1 hPa 4 April 1909.[239] |
| May | 13 May 2019 | Norderney, Lower Saxony | 1041.1 | 11.47 | | Based on NL record. |
| June | 7 June 1962 | List on Sylt, Schleswig-Holstein | 1037.8 | 24.7 | | Based on NL & DK. |
| July | 16 July 2006 | Waren (Müritz), Mecklenburg-Vorpommern | 1034.3 | 72.6 | | Based on Berlin. |
| August | 4 August 1981 | Neustadt an der Weinstraße, Rhineland-Palatinate | 1038.3 | 163 | | Based on Berlin |
| September | 25 September 2018 | Zwiesel, Bavaria | 1042.8 | 614.7 | | Based on NL and Lux. |
| October | 18 October 1993 | Parow Airport, Mecklenburg-Vorpommern | 1042.8 | 4 | | Based on Berlin. |
| November | 18 November 1985 | Arkona, Mecklenburg-Vorpommern | 1046.5 | 42 | | Based on DK, offshore same value at Kiel Leuchtturm. CRU Emulate data 11 November 1859 in Jena have a value of 1046.01 hPa.[240] |
| December | 23 December 1963 | Berlin Tempelhof Airport | 1049.6 | 48 | | | |
Central Europe
Austria
- A high pressure on 16 January 1882 Vienna 1050.5 hPa, the highest there since 1775.
The highest value is likely to have occurred during the 1907 high pressure event.[241] Deutsche Seewarte gives an evening reading on 23 January 1907 in Vienna of 790.7mmHg.
- A low pressure could possibly be 2 or 3 Dec 1976 (Based on HU and CZ records) <970 hPa.
Czechia
Hungary
The Hungarian Meteorological Service (OMSZ) gives the following values:
According to an expert article in the Hungarian journal Pótfüzetek a Természettudományi Közlönyhöz, the highest reading in Budapest on 24 January 1907 was 793.1mmHg at 8 hrs. A Hungarian meteorological journal Időjarás reports 793mmHg in Budapest on the same day.
Italy
Liechtenstein
A private weather station in Balzers, southwest Liechtenstein reported on 28 December 2016 a value of 1046.4 hPa under the high named Yörn, described as a record by the Liechtensteiner Vaterland.[249]
Poland
- The Polish Institute of Meteorology and Water Management list a record high pressure (post-war) on 16 December 1997 with 1054.4 hPa recorded in Suwalki.[250]
It is likely 23 January 1907 saw a pressure of 1064.8 ± 0.5 mbar over Polish territory.[11] Deutsche Seewarte gives morning readings on 23 January 1907 in Nowy Port (Neufahrwasser) of 798.2mmHg, in Darłowo (Rügenwalde) and Warsaw (Warschau) of 796.5mmHg, in Świnoujście (Swinemünde) of 795mmHg and in Kraków (Krakau) of 794.2mmHg. According to an article in the German-Austrian expert journal Meteorologische Zeitschrift, on 23 January 1907 Suwalki reached 797.5mmHg and Warsaw (Warschau) 796.3mmHg at 7 hrs, while Nowy Port (Neufahrwasser) 797.9mmHg at 13 hrs. In another article in the same journal, Rudzki reports the highest value in Kraków of 794.4mmHg on 23 January 1907 at 10 a.m.
Other high pressures are reported as 1051.1 hPa January 22, 2006, 1050 hPa January 3, 1993 and 1048 hPa 10 December 1991.
- The lowest post WWII value of 965.2 hPa is reported from February 26, 1989 in Szczecin and Łódź.[251]
Reanalysis data show a low record likely occurred on 17 January 1931 when a below 960 hPa low moved over the Baltic skirting the very north of today's Polish territory.[252]
Slovakia
The Slovak Hydrometeorological Institute report:
- Low air pressure (1961-2010): 3 December 1976 Boľkovce 970.2 hPa[255] (the lowest published value; though is not thought to be a correct absolute minimum)[253]
Slovenia
The Slovenian Environment Agency (ARSO) tweeted that pressure on 20 January 2020 reached 1048 hPa, slightly below the values seen on January 24, 1907 and 24 December 1963.[256]
Switzerland
27 December 2016 during the high pressure Yörn Bischofszell reported a QFF value of 1048.3 hPa.[259] [260] With the weather station at Zürichberg reporting its highest ever value since the station was established in 1949.[261]
Other high pressures in Switzerland are given as 3–4 March 1990 at Zurich Airport of >1047 hPa[262] and 29 January 1989 at Schaffhausen of 1047.2 hPa, which was the highest pressure in the country since the 1950s, when values on 15 February 1959 at Kloten reached 1047.1 hPa.[263] [264] A high value of 1050.2 hPa at Bern on 17 January 1882 is proposed as having occurred (on an internet forum).[265] Though values in MeteoSwiss annals are unreduced to MSLP.[266]
Southeast Europe
Croatia
On 21 January 2020 the Croatian Meteorological and Hydrological Service (DHMZ) tweeted a high pressure value at Kutjevo in eastern Croatia at 1050 hPa.[268]
Serbia
Deutsche Seewarte gives a morning reading on 24 January 1907 in Belgrade of 791.2mmHg.
Romania
- A high air pressure on 24 January 1907 is reported at >1060 over Romania.[4]
Articles in expert journals Időjarás and Pótfüzetek a Természettudományi Közlönyhöz report 797mmHg on 24 January 1907 in Sibiu (Nagyszeben). Deutsche Seewarte gives a morning Sibiu (Hermannstadt) reading on 24 January 1907 of 796.8mmHg.
Greece
- A high pressure: 24 January 1907 Athens 8 am daily reading 787.7mmHg.[269]
- A low pressure: 21–22 January 2004 Icaria 972 hPa.[270] [271]
Eastern Europe
Ukraine
A reading of 798mmHg in Ternopil (Ternopol) on 24 January 1907 is reported by an expert article in the Hungarian journal Pótfüzetek a Természettudományi Közlönyhöz. According to an article in the German-Austrian expert journal Meteorologische Zeitschrift, Lviv (Lemberg) reached 797.6mmHg on 23 January 1907 at 21 hrs. Deutsche Seewarte gives morning readings on 23 January 1907 in Lviv (Lemberg) of 796.3mmHg.
Belarus
Deutsche Seewarte gives a morning reading on 24 January 1907 in Pinsk of 795.2abbr=onNaNabbr=on.
Iberia
Spain
On 29 January 1905 Instituto Central Meteorológico report in Santander an evening reading of 788.5mmHg.[275]
Balearic islands
- Highest air pressure: 9 January 2015, Ibiza Airport 1041.1 hPa.[277] The 9 January 2015 air pressure was 0.3 hPa more than the previous record from January 1983.[277]
Portugal
- A low air pressure: 15 February 1941 in Évora at 931 hPa is reported by one source, which also reports a minimum value of 937 hPa in Coimbra and 950 hPa in Lisbon during the passage of this low pressure.[281] The Instituto Português do Mar e da Atmosfera give a value of 938.5 hPa at station level for Coimbra (not MSLP).[282] Other sources only give minimum values of around 950 hPa in Lisbon as the minimum during the passage of this low.[283] [284] Garnier et al. (2018) state a pressure of 948.29 hPa recorded by the meteorological services on 15 February 1941, which is described as the lowest pressure recorded in the Algarve area since 1854.[285]
Notable non-tropical pressures over the North Atlantic
See also: Explosive cyclogenesis and List of European windstorms.
Notable atmospheric pressure reports from offshore and in the North Atlantic are:
- High pressure, 28 January 2003 saw high of 1057 centred at 51° N, 27° W (approx. 1000km north of Azores).[70]
A lower value is reported from 27 to 28 February 1988 at 1053 hPa centred at approximately 53.5° N, 25.6° W.[70]
- Low pressure, Two or three (possibly four) non-tropical areas of low pressure with central low pressure over the North Atlantic below 920 hPa have been reported, with a further unverified instance during the Night of the Big Wind (see above), these represent globally the lowest non-tropical large-scale synoptic values.
- 13 January 1993 Braer Storm dropped 78 hPa in 24 hours,[173] [286] to a central pressure out in the Atlantic at 62° N, 15° W of 914.0 hPa, and was likely the deepest cyclone on record for the North Atlantic, and very probably for any temperate latitude.[287]
- 14–15 December 1986, The British Meteorological Office assessed the centre of a depression at about 916 hPa, the West German Meteorological Service enclosed the depression with a 915 hPa isobar, indicating a pressure possibly as low as 912–913 hPa.[288]
For comparison, the lowest Atlantic basin tropical cyclone low pressure is Hurricane Wilma in 2005, which holds the record at 882 hPa.[289] (see list of most intense tropical cyclones in the North Atlantic).
Similarly low extra-tropical values elsewhere have only been documented near Antarctica, with 919 hPa observed at Casey Station on the Windmill Islands (just outside the Antarctic Circle) on August 8–9, 1976 at Vincennes Bay (66°17’S 110°31’E).[290] Though this value is considerably lower than any other on record and could conceivably be a fault with the recording instrument, though values are internally consistent with readings below 940 mb at this time.[154] A study published in Geophysical Research Letters in July 2023 on an extratropical cyclone in the Southern Ocean in October 2022 estimated that the cyclone reached a pressure of while also estimate four other cyclones in the same region with pressures below or equal to .[291]
The two lowest extra-tropical pressures reported from the Pacific basin are the 8 November 2014 Bering Sea cyclone at 924 hPa (warnings for the low to reach 920 hPa were released by the Japan Meteorological Agency[292]),[293] and the 13 December 2015 North Pacific low at 924 hPa.[294] 31 December 2020 NWS OPC analysis of a low 52N 173E down to 921 hPa.[295] [296]
North Atlantic low pressures below 940 hPa
During a typical winter, one or perhaps two low pressure areas in the North Atlantic will deepen below 950 hPa, with pressures only deepening below 940 hPa on average once or twice per decade.[297] Before the satellite and weather model era, records (mostly from shipping) reported barometric pressures over the extratropical North Atlantic as going as low as 925 hPa, with values below 940 hPa being very rare occurrences.[298] The frequency of very deep depressions (central pressure below about 940 hPa) in the North Atlantic is thought to have increased significantly since the winter of 1982/83 to 1993.[287]
Table of North Atlantic low pressures below 940 hPa (incomplete)
| Date | Location | Notes | Pressure hPa | Ref. |
|---|
| 1822, 8 February | Reykjavik, Iceland | Onshore reading | 926.5 | |
| 1824, 4 February | Reykjavik, Iceland | Onshore reading | 924 | |
| 1838, 28 November | Limerick, Ireland | Onshore reading | 931.2 | |
| 1839, 6 January | Northwest of Scotland | During the Night of the Big Wind low pressure may have reached a low of 914 hPa, though a value of 918 hPa is generally accepted. Though analysis of the land-based observed pressures indicate higher minima, around 931 hPa, and subsequently the depression's nadir at sea could be higher than proposed.[299] | 918 | [300] |
| 1852, 21 January | Reykjavik | | 937.7 | [301] |
| 1865, 31 December | Butt of Lewis Lighthouse, Scotland | A report of 27.63inHg from Hoy, Orkney, which is not supported by observation from Cantick Head Lighthouse on South Walls. | 937.7 | |
| 1870, 5 February | 49° N, 26° W | The ship Neier (49° N, 26° W) reported and observation of 921.1 hPa, supported by an observation on the HMS Tarifa (51° N, 26° W) of 925.5 hPa. | 921.1 | |
| 1877, 11 November | Monach Lighthouse, Outer Hebrides | Onshore observation | 939.7 | |
| 1884, 26 January | Ochtertyre, Perthshire | Lowest land based observation in the UK. 26 January record observed low pressure Ireland for that month at Markree Castle, Sligo 936.6 hPa. On 27 January 1884 Bergen in Norway reported an onshore observation of 939.7 hPa.[302] | 925.6 | |
| 1886, 8 December | Belfast | Land observation, the low probably reached values of around 924 hPa over Northern Ireland, lowest value reported on the island of Ireland. | 927.2 | |
| 1888, 23 December | Reykjavik, Iceland | | 929 | [303] |
| 1895, 6 December | Härnösand, Sweden | 939.5 hPa was reported at Lungö Lighthouse (62° N, 18° E) on 6 December 1895.[304] | 938.4 | |
| 1907, 27 January | Bergen | Onshore observation | 936 | |
| 1907, 20 February | East of the Shetland Islands | Low brought record observed low pressure to Denmark and Norway. (nadir ~934) | 934 | [305] |
| 1914, 27 December | Vestmannaeyjar, Iceland | | 929.0 | |
| 1924, 26 December | Grindavík, Reykjanes Iceland. | | 933.7 | [306] |
| 1925, 7–8 February | Iceland | Halaveðrið | 935 | [307] |
| 1929, 2 December | | Onshore observation (could be same system as 4 December 1929)[308] The reading could have been as low as 919.7 hPa. | 920 | |
| 1929, 4 December | Unknown | Reported by the ship SS Westpool in an unknown location in the North Atlantic (could be same system as 2 December 1929). | 925.5 | |
| 1933, 3 January | Reykjavik, Iceland | Onshore reading of a low thought to be filling. 931.4 hPa recorded at Akureyri, the lowest pressure measured there. | 927.2 | |
| 1945, 19 December | Between Iceland and Ireland | Lowest onshore measurement reported from Valentia, Ireland at 948.6 hPa, estimated central minimum of 927 hPa. | 927 | |
| 1948, 2 February | SW of Iceland | | 933 | [309] |
| 1949, 25 January | Dalatangi lighthouse, Mjóifjörður, east Iceland | Onshore report of 941 hPa with a central pressure offshore thought to be 940 hPa. | 940 | [310] |
| 1952, 27 October | 53° N, 18.5° W | A vigorous development deepened around to a proposed low of 922 hPa, though the contemporary reports suggest 935–936 hPa as a more probable value. | 935.5 | |
| 1962, 16 January | 56° N, 19° W Ocean Weather ship 'Lima' | | 931.1 | |
| 1962, 13 February | Vidzeme Upland, Latvia | | 932.9 | |
| 1963, 19 October | Iceland | Onshore reading 938.4 hPa at Stórhöfði, Ex-Hurricane Flora. | 935 | |
| 1972, 7 January | Near Ocean Weather ship Charlie | | 935 | [311] |
| 1974, 10–11 January | 56° N, 22.5° W | North west of Ireland, Met Éireann estimated the low deepened to a low of 936 hPa at 57° N, 21° W.[312] | 934 | |
| 1982, 8 February | SW Iceland | ~932. 934 hPa in Daily Weather Report.[313] | 932 | |
| 1982, 16 December | Sundsvall | 16 December an extreme low airpressure was identified in Sweden, centred on Sundsvall where recording instruments showed 939 hPa, nearly equalling the Swedish national record.[314] 940.1 according to SMHI.Väike-Maarja, Estonia reported a station level value of 936.0 hPa. | 939 | |
| 1982, 19–20 December | 58.5° N, 15° W | The 20th Century low pressure record onshore in the UK occurred on 20 December 1982 at Sule Skerry dropping as low as 936 hPa. 937.6 hPa was recorded at Stornoway on 20 December 1982 as the lowest barometric pressure observed anywhere in the British Isles since 1886. | 931 | |
| 1983, 5 January | South of Iceland, | 929.9 hPa reported from Stórhöfði, Vestmannaeyjar.[315] Could be the same low as mentioned in January 1983 by Brown (1995) at ~932 hPa. | 930 | |
| 1983, 26 December | South east of Greenland | | 936 | |
| 1986, 14–15 December | 61° N, 32° W | The ship Uyir measured a pressure of 920.2 hPa south east of Greenland on December 15, 1986. The Met Office estimated a central pressure of 916 hPa. The West German weather Service estimated the low could have reached as low as 912–913 hPa. | 916 | [316] [317] |
| 1989, 4–5 January | Offshore Nova Scotia | "ERICA IOP4 storm" post-analysis suggested that the pressure fell to a possible low of to 928 hPa. This was the lowest pressure ever observed in an Atlantic extratropical cyclone south of 40 degrees latitude in the 20th century. | 936 | [318] |
| 1989, 15 February | Ocean weather station Mike, Norwegian sea 66° N, 2° E | Pressure likely to have dropped to 935.5 hPa, as the recorder was not able to print the lowest pressure. | 937.1 | [319] |
| 1989, 29 October | | CFS reanalysis chart, 921 hPa.[320] | 926 | [321] |
| 1989, 24 December | South west of Iceland | Estimated at a little below 920 hPa. 929.5 hPa reported from Stórhöfði, Vestmannaeyjar. | 920 | |
| 1990, 1 March | Finland | This value is not reported by the Finnish Meteorological Institute. | 939.7 | |
| 1992, 2 March | Offshore of Newfoundland | | 926 | |
| 1992, 23 November | Offshore SE Iceland | | 938 | [322] |
| 1992, 29 November | East of Cape Farewell, Greenland lee low | 931.5 [323] | 936 | |
| 1993, 10 January | 62° N, 15° W North Atlantic west of Faroe Islands | Braer storm was the deepest cyclone on record for the North Atlantic, and very probably for any temperate latitude 912–915 hPa. Low claimed to have reached a nadir of 913, with 916 confirmed.[324] 914[325] [326] | 914 | |
| 1999, 15–16 January | South of Iceland | Ship Dettifoss (P3BK4) reported 928 hPa. MeteoFrance publication 925 hPa. | 926 | [327] [328] [329] |
| 1999, 25 December | Between Scotland and Norway | A Central Forecasting Office, Bracknell analysis gave a lowest pressure of 938 hPa, based on reported pressures of 940 hPa over the North Sea. Buoy 63113 at 61°N 1.7°E reported a minimum pressure of 937.6 hpa at 1300 UTC 25 December.[330] | 938 | [331] |
| 1999, 31 December | 59° N, 35° W | Formation of two sub 940 lows in 1999 book-ended the destructive Cyclone Lothar and Martin in Europe. | 929 | |
| 2003, 8 March | Central Atlantic | Named "Gordian" by the Free University of Berlin, analysed by them to have deepened below 940 hPa.[332] | 924 | [333] |
| 2006, 10 December | 62° N, 37° W | Named "Xynthia" by the Free University of Berlin, who estimated central pressure below 930 hPa.[334] | 928 | [335] |
| 2007, 12 December | | | 928 | [336] |
| 2009, 23 January | Between Iceland and Scotland | Named "Hans" by the Free University of Berlin.[337] | 938 | [338] |
| 2011, 10 February | 56° N, 32° W | Named "Paolini" by the Free University of Berlin.[339] [340] | 935 | [341] |
| 2013, 26 January | | Named "Jolle" by Free University of Berlin | 932 | [342] [343] [344] |
| 2013, 24 December | | Cyclone Dirk, this was the lowest barometric pressure observed at any site in the British Isles, and the deepest depression to pass close to the British Isles, since 8 December 1886, 936.4 hPa at Stornoway was reported on minute observations at 12:29, with 936.8 hPa recorded at the 13:00 hourly observation. At the southernmost tip of the Faroe Islands a low air pressure of 932.2 hPa was recorded on Christmas Eve at Akraberg lighthouse.[345] | 927 | [346] [347] |
| 2014, 5 January | 51° N, 36° W | Christina | 934 | |
| 2015, 5 December | South of Iceland | Desmond | 939 | [348] [349] |
| 2015, 29 December | South east of Iceland | Frank/Eckhardt.[350] | 928 | [351] |
| 2016, 21 December | SW of Jan Mayen (70° N, 13° W) | Named Zarina by FUB. Low mimima likely over Arctic Ocean. ECMWF model estimated low down to 937 hPa.[352] | 940 | [353] |
| 2017, 6 February | 54° N, 30° W | Named Niklas by FUB,[354] UKMO chart down to 929 hPa,[355] NWSOPC 932 hPa,[356] [357] DMI 935 hPa.[358] | 932 | [359] |
| 2017, 25 February | Between Greenland and Iceland | Named Udo by FUB,[360] 938 hPa UKMO analysis chart 06 UTC 25 Feb 2017.[361] | 939 | |
| 2018, 14 January | Close to Jan Mayen | Named Evi by FUB,[362] 935 hPa 1800 UTC 14 Jan 2018 UKMO Analysis chart,[363] | 935 | |
| 2018, 12 October | West of Ireland | Named Callum by UK and Irish Met Offices, Nevine by FUB,[364] 938 hPa 0000 UTC 12 Oct 2018.[365] Met Éireann forecasters commentary gave a value as low as 936 hPa.[366] 937 hPa. Reported as the lowest early season pressure for an extratropical Atlantic storm since at least 1979 by Met Éireann.[367] | 938 | |
| 2019, 20 February | 53° N, 33° W | Named Julia by the Instituto Português do Mar e da Atmosfera. NWS OPC analysis 934 hPa.https://commons.wikimedia.org/wiki/File:NWS_OPC_analysis_of_deep_low_named_Julia_(IPMA)_20_February_2019.png. UKMO 936 hPa.[368] | 934 | [369] |
| 2020, 8 February | 63° N, 37° W | Named "Ruth" by the Free University of Berlin.[370] NWS "Greenland Bomb".[371] | 930 | [372] |
| 2020, 14 February | 59° N, 24° W | Named "Uta" by the Free University of Berlin. 929 NWS[373] NWS "Iceland Bomb". | 933 | |
| 2020, 15 February | 63° N, 20° W | Named "Dennis" by UKMO, "Victoria" by Free University of Berlin.[374] Onshore 932.3 hPa reported from Surtsey, Iceland.[375] UKMO 922 hPa. ECMWF 919 hPa.[376] | 920 | |
| 2020, 16 December | NE of Newfoundland | "Eva" FUB | 938 | [377] |
| 2022, 6 January | SE of Greenland | "Barbara" FUB, UKMO 931 hPa. NWS forecast 928 hPa.[378] | 931 | [379] |
| 2022, 7 February | Between Iceland and Greenland | "Sarai" FUB,[380] UKMO 930 hPa. NWS 928.[381] | 930 |
| 2022, 14 March | South of Greenland | UKMO 929. 927.[382] Onshore locations in Greenland reported lows of 935.7 (or as low as 934.1).[383] | 929 | |
| 2022, 24 September | Nova Scotia | Post-tropical Cyclone Fiona, thought to be the lowest pressure observed in Canada. | 931 | |
| 2022, 4 November | | Post tropical Cyclone Martin | 934 | [384] | |
See also
External links
Notes and References
- Book: Oliver. John E.. Encyclopedia of world climatology. 2008. Springer. Dordrecht, Netherlands. 978-1402032646. Reprinted with corrections.. 361.
- Olsson. Markus. Extrema lufttryck i Europa och Skandinavien 1881–1995. Masters Thesis. 1996. 30 September 2015. Extreme air pressure in Europe and Scandinavia 1881–1995. Lund University. sv.
- News: Müller. Mandy. Lebensgeschichte: Hochdruckgebiet EVI. 18 July 2015. Free University of Berlin. 24 January 2008. de.
- Hovmøller. Ernest. En næsten utrolig rekord. Vejret. 1986. 26. 5–10. 1 November 2017. da. 0106-5025.
- Web site: Reanalysis 1956 02 16. wetterzentrale. 14 September 2015. 8 December 2015. https://web.archive.org/web/20151208122935/http://www.wetterzentrale.de/pics/archive/ra/1956/Rrea00119560216.gif. dead.
- News: Treinzen. Matthias. Lebensgeschichte Hochdruckgebiet DIETER. 29 July 2015. Free University Berlin. 29 March 2012. de.
- Andrews. James F.. The Weather and Circulation of February 1956. Monthly Weather Review. 1956. 10.1175/1520-0493(1956)084<0066:TWACOF>2.0.CO;2. 84. 2. 66–74. 1956MWRv...84...66A. free.
- Web site: Daily Weather Report: 16 February 1956. Met Office. 6 August 2015. 8 December 2015. https://web.archive.org/web/20151208150303/https://eu.preservica.com/Render/render/pdf?typeFile=d9dc6b8e-d500-4bda-b3d3-20adcaed149b&tenant=METOFFICE. dead.
- News: Daily decoded synop report. Ogimet.
- News: Höga lufttryck- svenskt februarirekord. 30 November 2015. SMHI. 1 February 2012. sv.
- News: Djaków. Piotr. Maksymalne ciśnienie w Polsce 23 stycznia 1907 (Aktualizacja!). 26 August 2015. meteomodel.pl/BLOG. 29 August 2013. pl.
- Burt. Stephen. Intense anticyclone over north-west Russia, early January 2008. Weather. June 2008. 63. 6. 174–176. 10.1002/wea.220. 2008Wthr...63..174B. 122350841.
- News: Jónsson. Trausti. Lægsti loftþrýstingur á Íslandi. 9 June 2015. Veðurstofa Íslands. 4 October 2007. is.
- Shields. Lisa. Denis. Fitzgerald. The 'Night of the Big Wind' in Ireland, 6–7 January 1839. Irish Geography. 1989. 22. 1. 31–43. 10.1080/00750778909478784. 129732231 . 8 September 2015. 4 March 2016. https://web.archive.org/web/20160304002731/http://www.met.ie/climate-ireland/weather-events/Jan1839_Storm.PDF. dead.
- Ólafsson . Haraldur . Furger . Markus . Brümmer . Burghard . The weather and climate of Iceland . Meteorologische Zeitschrift . 28 February 2007 . 16 . 1 . 5–8 . 10.1127/0941-2948/2007/0185. 2007MetZe..16....5O .
- News: Jónsson . Trausti . Af árinu 1892 . 28 February 2019 . trj.blog.is . 24 February 2019.
- News: Jónsson . Trausti . Nýtt háþrýstimet júnímánaðar - trj.blog.is . 12 June 2019 . trj.blog.is . is.
- News: Jónsson . Trausti . A new sea level pressure record for June in Iceland . 14 June 2019 . icelandweather.blog.is . 13 June 2009.
- Web site: Jónsson . Trausti . Atlaga að loftþrýstimeti ágústmánaðar - trj.blog.is . trj.blog.is . 1 September 2021 . Icelandic.
- Web site: Tíðarfar í ágúst 2021 . Veðurstofa Íslands . is.
- News: Jónsson . Trausti . Nýja októberháþrýstimetið . 28 October 2018 . trj.blog.is . 27 October 2018 . is.
- News: Oktober 2018 - Kraftiga regn i Medelhavsområdet. 14 December 2018 . www.smhi.se . 8 November 2018 . sv.
- News: Jónsson . Trausti . Atlaga að meti? . 22 October 2018 . trj.blog.is . 22 October 2018 . is.
- News: Hæsti loftþrýstingur októbermánaðar . 3 November 2018 . RÚV . 27 October 2018 . is.
- News: Jónsson. Trausti. Hæsti loftþrýstingur á Íslandi. 9 June 2015. Veðurstofa Íslands. 4 October 2007. is.
- News: Jónsson . Trausti . Af árinu 1846 - trj.blog.is . 21 September 2020 . trj.blog.is . 20 September 2020. is.
- News: Jónsson . Trausti . Af árinu 1890 - trj.blog.is . 7 December 2018 . trj.blog.is . 6 December 2018 . is.
- News: Trausti . Jónsson . Af árinu 1891 . 16 February 2019 . trj.blog.is . 4 February 2019.
- News: Jónsson . Trausti . Unusually high sea level pressure - icelandweather.blog.is . 28 March 2020 . icelandweather.blog.is . 28 March 2020.
- News: Tíðarfar í mars 2020 . 13 May 2020 . Veðurstofa Íslands . is.
- Web site: Emulate, Stykkisholmur. Emulate. CRU. 8 August 2015.
- News: Jónsson . Trausti . Enn á hann að sækja að . 3 February 2020 . trj.blog.is . 3 February 2020 . is.
- hungurdiskar . 1502658006235983873 . The Labrador/Greenland low pressure: Unusual for the area - and the month of year. Similar to the lowest ever March sea level pressure measured in Iceland (in Icelandic - but with numbers and maps).
- News: Jónsson . Trausti . Óvenjudjúp lægð - miðað við árstíma - trj.blog.is . 16 April 2019 . trj.blog.is . 13 April 2019 . is.
- News: Jónsson . Trausti . Óvenjudjúp lægð við Svalbarða - trj.blog.is . 13 May 2020 . trj.blog.is . 13 May 2020 . is.
- News: Jónsson . Trausti . Liggja í loftinu . 13 June 2018 . trj.blog.is . 12 June 2018 . is.
- WorldClimateSvc . 1296445780740513794 . 20 August 2020 . Last night's #StormEllen in Ireland brought the first sub-970mb MSLP to the British Isles in summer since at least 1979 (@CopernicusECMWF ERA5 data). The ERA5 North Atlantic and Northern Hemisphere summer record north of 45°N is 958.0 mb near Iceland on June 11, 1983 .
- News: Jónsson . Trausti . Lágur loftþrýstingur - miðað við árstíma - trj.blog.is. 16 July 2020 . trj.blog.is . 16 July 2020 . Is.
- News: Jónsson . Trausti . Haustlægð? . 26 August 2019 . trj.blog.is . 26 August 2019 . is.
- News: Trausti . Jónsson . Af árinu 1906 . 13 November 2018 . trj.blog.is . 12 November 2018 . is.
- News: Jónsson . Trausti . Ekki oft . 13 October 2018 . trj.blog.is . 11 October 2018 . is.
- News: A new low pressure record for July in Iceland. 9 June 2015. Vedur.is. 23 July 2012.
- News: Storico Record Nazionale di Pressione Bassa in Islanda. 972.4hPa il 22 luglio 2012!. 1 September 2016. 31 July 2012. it-IT. 25 September 2016. https://web.archive.org/web/20160925002650/http://recordmeteo.altervista.org/storico-record-nazionale-di-pressione-bassa-in-islanda-972-4hpa-il-22-luglio-2012/. dead.
- News: Jónsson . Trausti . Af árinu 1901 . 18 December 2018 . trj.blog.is . 17 December 2018 . is.
- News: Tíðarfar í desember 2015. 4 January 2016. Veðurstofa Íslands. 4 January 2016. is.
- News: Vejrekstremer på Færøerne. 14 September 2020. Danish Meteorological Institute. 9 September 2020. da.
- Web site: Emulate, Torshavn. Emulate. Climatic Research Unit. 8 August 2015.
- News: Provisional Report on New Atmospheric Pressure Records for Land and Sea - Met Éireann - The Irish Meteorological Service . 30 March 2020 . www.met.ie . 30 March 2020 . en.
- News: Climate Statement for March 2020 . 12 April 2020 . Met Éireann . April 2020.
- Eden. Philip. May 2012. Cool and changeable first three weeks, then warm and sunny. Weather. July 2012. 67. 7. i–iv. 10.1002/wea.1865. 123551889 .
- Web site: Monthly Weather Bulletin September 2009 . Met Éireann . 2 November 2018.
- News: Past Weather Statements - September 2018 . 8 October 2018 . www.met.ie . Met Éireann . October 2018 . en.
- News: Monthly Weather Bulletin. 5 October 2016. 263. Met Éireann. March 2008. 6 October 2016. https://web.archive.org/web/20161006041405/http://www.met.ie/climate/MonthlyWeather/clim-2008-Mar.pdf. dead.
- News: Krummel. Jasmin. Tiefdruckgebiet JOHANNA. 26 March 2018. www.met.fu-berlin.de. Free University of Berlin. 14 April 2008. de.
- MetEireann . 1296414564968472578 . 20 August 2020 .
- StormEllen broke Mean Wind Speed (111 km/h) & MSL Pressure (966.4 hPa) records for August. As our climate continues to change we expect more weather records to be broken.
.
- News: Storm Ellen . 20 August 2020 . Met Éireann . 20 August 2020.
- News: Schöne. Andrea. Tief CAROLIN. 26 March 2018. www.met.fu-berlin.de. Free University Berlin. 16 November 2004. de.
- Barometric Depression of December 8th–9th.. Symons's Monthly Meteorological Magazine. December 1886. 30 November 2017.
- News: Amos. Jonathan. Huge weather rescue project under way. 30 November 2017. BBC News. 30 November 2017.
- News: National Meteorological Library and ArchiveFact sheet 9 — Weather extremes. 31 May 2015. Met Office. dead. https://web.archive.org/web/20121028123740/http://www.metoffice.gov.uk/media/pdf/c/f/Fact_sheet_No._9.pdf. 28 October 2012.
- metoffice. 1244289591152173059 . 29 March 2020 . We've seen a new #pressure record for #March today and it's one of the highest pressures we've measured in almost 100 years.
- Web site: Monthly Weather Report (March 1990). Met Office. 29 February 2020.
- Burt . Stephen . New British and Irish Isles late-winter extreme barometric pressure, 29 March 2020 . Weather . 16 October 2020 . 76 . 3 . 72–78 . 10.1002/wea.3840. free .
- simonleewx . 1244290224257187840 . 30 March 2020 . All credit for this goes to Stephen Burt - the Tynemouth record from 9 March 1953 for March maximum MSLP of 1048.6 hPa is erroneous. The original observations were corrected to 1043.6 hPa, so likely that 1048.6 hPa was reported through poor handwriting..
- Web site: UKWeatherWorld forum:UK High & Low Pressure Records by Month. UKWeatherWorld. 31 May 2015 . 24 June 2015.
- News: UK: Highest June MSLP. 1 August 2015. exmetman. 8 June 2015. 29 June 2015. https://web.archive.org/web/20150629162514/https://xmetman.wordpress.com/2015/06/08/uk-highest-june-mslp/. dead.
- August 2021 A very dull month for many . Weather . October 2021 . 76 . 10 . 10.1002/wea.4082 . 247697716 . 0043-1656.
- eddy_weather . 1432966713239379971 . Yet another #Stornoway weather record established yesterday! 1038.0hPa sea-level air pressure at 21z ranks as the highest ever recorded August air pressure in UK & Ireland (with thanks to S. Burt for notification).
- Burt. Stephen. Britain's highest atmospheric pressure on record is incorrect. Weather. 1 July 2006. 61. 7. 210–211. 10.1256/wea.40.06. 2006Wthr...61..210B. 119485783 .
- Burt. Stephen. The Highest of the Highs … Extremes of atmospheric pressure in the British Isles, Part 2 – the most intense anticyclones. Weather. February 2007. 62. 2. 31–41. 10.1002/wea.35. 2007Wthr...62...31B. free.
- metoffice. 1219028820977704961 . 19 January 2020 . So far Mumbles Head in Wales appears to have recorded the highest pressure during this current settled spell, with 1050.5 hPa earlier this evening. .
- Burt . Stephen . London's highest barometric pressure in over 300 years . Weather . April 2020 . 75 . 4 . 109–116 . 10.1002/wea.3688. 2020Wthr...75..109B . 218843549 .
- News: Amos . Jonathan . London breaks a high-pressure record . 20 January 2020 . 20 January 2020.
- News: Burt . Stephen . London just broke a 300-year-old weather record – but you probably didn't even notice it . 21 January 2020 . The Conversation . 21 January 2020 . en.
- Web site: How unusual are deep lows in August? . xmetman . 9 August 2019 . 8 August 2019 . 9 August 2019 . https://web.archive.org/web/20190809140357/https://xmetman.com/how-unusual-are-deep-lows-in-august/ . dead .
- Web site: DWS 1992 08 Met Office UA . digital.nmla.metoffice.gov.uk . 9 August 2019.
- metoffie . 1720055662888063363 .
- StormCiarán has set a new record for the lowest mean sea level pressure recorded in England and Wales in November, with a value of 953.3 hPa in Plymouth and 958.5 hPa in St Athan. The previous record in England was 959.7 hPa, set in 1916 .The previous record in Wales was 962.7 hPa, set in 2010. The record for the UK remains unbroken, and was set in Scotland in 1877 with a value of 939.7 hPa.
.
- News: Stephen Burt on Storm Ciaran - University of Reading . 4 November 2023 . www.reading.ac.uk.
- Web site: Burt. Stephen. Deep low, 24 December 2013. Climatological Observers Link. 30 November 2015. 8 December 2015. https://web.archive.org/web/20151208173215/http://www.uktrail.com/colchat/viewtopic.php?f=7&t=913. dead.
- 10.1002/j.1477-8696.2001.tb06547.x. The North Sea storm of 30 October 2000. Weather. 56. 3. 115–116. 2001. Hewson. Tim. 2001Wthr...56..115H. 119744773.
- News: Storm caused by most intense low to cross the UK in September in 30 years. 5 June 2015. Met Office Blog. 26 September 2012.
- Burt. S. D.. New UK 20Th Century Low Pressure Extreme. Weather. July 1983. 38. 7. 209–213. 10.1002/j.1477-8696.1983.tb03700.x. 1983Wthr...38..209B.
- February 1884. Symons's Monthly Meteorological Magazine. February 1884. 6 September 2015. 8 December 2015. https://web.archive.org/web/20151208131754/https://eu.preservica.com/Render/render/pdf?typeFile=c3255804-28ee-462b-b8a2-c52064ede8e7&tenant=METOFFICE. dead.
- News: Graham. Eddie. Lowest pressure for 127 years recorded in Stornoway today (Confirmed) + Storm Videos. 25 December 2013. UHI-Mahara. 24 December 2013.
- News: Haeseler . Susanne . Bissolli . Peter . Daßler . Jan . Volker Zins . Volker . Kreis . Andrea . Orkantief SABINE löst am 9./10. Februar 2020 eine schwere Sturmlage über Europa aus . 13 February 2020 . Deutscher Wetterdienst . 13 February 2020 . de.
- Web site: Daily Weather Report. Met Office. 1 October 2017. 2 October 2017. https://web.archive.org/web/20171002115437/https://www.metoffice.gov.uk/binaries/content/assets/mohippo/pdf/0/3/jan1905.pdf. dead.
- http://artikkel.yr.no/tidenes-trykk-1.12165870 Yr.no – Tidenes trykk
- News: Pedersen. Kamilla. Rekordhøyt trykk i Europa. 30 August 2017. NRK. Yr.no. 3 February 2012. no.
- Meteorologene . 682184619412819970. 30 December 2015 . Bare 930 hPa i stormsenteret over Island i formiddag! (Norges laveste lufttrykk målte 936 hPa, i Bergen, 27.01.1907) .
- News: Pedersen. Kamilla. Lavtrykk mot høytrykk. Yr.no. 11 November 2011. no.
- News: Lie. Bernt. Vær og Vind - YR.NO-LUFTTRYKK: - Vær og vind korrigerer Norges laveste og høyeste lufttrykk - Powered by Proweb. 11 June 2016. www.verogvind.net. 26 January 2015.
- News: Sjekk værrekordene der du bor. 4 December 2016. NRK. Yr.no. 1 December 2016. no. Norgesrekord: Laveste lufttrykk: 935.9hPa Målested: Bergen - Lungegårdshospitalet i Bergen, Hordaland Måletidspunkt: 27.01.1884.
- News: Venter historisk lavtrykk. 11 June 2016. VG. 22 December 2004.
- News: Høytrykkrekord feirer 101 år - met.no. 11 June 2016. met.no. 23 January 2008. 3 August 2016. https://web.archive.org/web/20160803064639/http://met.no/H%C3%B8ytrykkrekord+feirer+101+%C3%A5r.9UFRDGWS.ips. dead.
- Web site: Stasjon Mike Meteorologie. Geophysics Institute University of Bergen. 11 June 2016. no. dead. https://web.archive.org/web/20160805085700/http://web.gfi.uib.no/forskning/mike/meteorologi.html. 5 August 2016.
- News: Februari 2018 - Både milt och kallt . 17 June 2020 . www.smhi.se . SMHI . 20 December 2018.
- News: Rommertveit. Astrid. Superhøytrykket fortsetter i neste uke. 6 October 2016. NRK. Yr.no. 6 October 2016. no.
- News: Toppe. Ronald. Her kan det bli 20 grader. 6 October 2016. TV 2. 5 October 2016. no.
- News: Rekordhøytrykk. Vær og vind. 5 October 2016. no.
- News: Vejrekstremer i Danmark . 10 January 2020 . Danish Meteorological Institute . 7 January 2020 . da . https://web.archive.org/web/20161019211924/https://www.dmi.dk/vejr/arkiver/normaler-og-ekstremer/vejrekstremer-dk/ . 19 October 2016 . dead .
- Høgsholt. Danny. To stille vejrrekorder fylder 110 år. Vejret. May 2017. 151. 2. 8 February 2018. Dansk Meteorologisk Selskab. da. 9 February 2018. https://web.archive.org/web/20180209062956/http://dams.dk/Vejret/Vejret151.pdf. dead.
- News: Rasmussen. Michella. Scandinavia vejrrekorder. 10 November 2015. 7 February 2014.
- Danish Meteorological Institute Ministry of Transport Technical Report PDF. Docplayer.dk. 1399-1388.
- News: Brandt. Anders. Højeste lufttryk i Danmark i 27 år. 10 June 2015. TV2. 7 February 2012. da.
- Web site: Zeitzen . Rune . Ny rekord – 142 år gammel martsrekord smadret i nat - TV 2 . vejr.tv2.dk . 19 March 2022 . da-DK . 19 March 2022.
- News: Tæt på 'usynlig' rekord - usædvanligt højt lufttryk over Danmark - TV 2 . 23 March 2020 . vejr.tv2.dk . 23 March 2020 . da-DK.
- News: Christian. Lietzen. Europamestre i højtryk. 29 September 2015. DMI. 29 September 2015. da.
- News: Hogsholt. Danny. Tårnhøjt lufttryk over Danmark slår rekord. 30 September 2015. TV2. 29 September 2015. da.
- News: Trykket stiger - 139 år gammel vejrrekord falder i nat: DMI. www.dmi.dk. DMI. 4 October 2016. da. 4 October 2016. 5 October 2016. https://web.archive.org/web/20161005131323/http://www.dmi.dk/nyheder/arkiv/nyheder-2016/oktober/trykket-stiger-139-aar-gammel-vejrrekord-falder-i-nat/. dead.
- News: Vejret arbejdede på højtryk i nat - og slog 139 år gammel rekord. 5 October 2016. TV2. 5 October 2016. da-DK.
- Web site: Analysis. Free University of Berlin. 30 November 2015.
- News: Brandt. Anders. Højeste lufttryk i Danmark i 27 år. 30 September 2015. TV2. 7 February 2012. da.
- Craig . Philip M. . Hawkins . Ed . Digitizing observations from the Met Office Daily Weather Reports for 1900–1910 using citizen scientist volunteers . Geoscience Data Journal . 4 June 2020 . 7 . 2 . 116–134 . 10.1002/gdj3.93. 2020GSDJ....7..116C . free .
- SebastianTV2dk . 1505244180779520003 . The record-breaking high (for March) over Denmark was the fourth highest pressure measured in Denmark - tied with 1962 Top 5 is now:1062.2 hPa (1907) 1056.1 hPa (1902) 1052.5 hPa (1985) 1051.6 hPa (1962) 1051.6 hPa (2022) Nationwide measurements of air pressure began in 1874.
- News: Laveste lufttryk over Danmark i fem år. 31 October 2017. vejr.tv2.dk. 5 January 2012. da-DK.
- SebastianTV2dk . 1511930191299362818 . Laveste lufttryk målt i april i DK er 966,0 hPa..
- SebastianTV2dk . 1512338254246391808 . De 5 laveste lufftryk målt i april i DK er nu: 966,0 hPa (1876).
- Web site: Lavtryk på vej mod Danmark kan blive det kraftigste i maj i 24 år - TV 2 . vejr.tv2.dk . 4 May 2021 . da-DK . 3 May 2021.
- Rosenørn. Stig. De kraftigste storme i det tyvende århundrade i Danmark. Vejret. 82. February 2000. 15–18. 1 November 2017. da. 7 November 2017. https://web.archive.org/web/20171107030353/http://dams.dk/Vejret/Vejret82.pdf. dead.
- News: Lufttryck. 6 June 2015. SMHI. 23 April 2014. sv.
- News: Svenska lufttrycksrekord. 6 June 2015. SMHI. 23 April 2014. sv.
- News: Högsta uppmätta lufttryck i Sverige i januari. 9 July 2015. SMHI. 23 April 2014. sv.
- News: Högsta uppmätta lufttryck i Sverige i februari. 9 July 2015. SMHI. 23 April 2014. sv.
- News: Hellström. Sverker. Summering av det mäktiga högtrycket. 7 March 2018. www.smhi.se. 2 March 2018. sv-SE.
- News: Högsta uppmätta lufttryck i Sverige i mars. 9 July 2015. SMHI. 23 April 2014. sv.
- News: Högsta uppmätta lufttryck i Sverige i april. 9 July 2015. SMHI. 23 April 2014. sv.
- News: Högsta uppmätta lufttryck i Sverige i maj. 9 July 2015. SMHI. 23 April 2014. sv.
- News: Svenska lufttrycksrekordet för maj fyller 130 år på söndag . 1 June 2023 . www.smhi.se . swedish.
- News: Högsta uppmätta lufttryck i Sverige i juni. 9 July 2015. SMHI. 23 April 2014. sv.
- News: Högsta uppmätta lufttryck i Sverige i juli. 9 July 2015. SMHI. 23 April 2014. sv.
- News: Högsta uppmätta lufttryck i Sverige i augusti. 9 July 2015. SMHI. 23 April 2014. sv.
- News: Nytt svenskt lufttrycksrekord för september SMHI. 28 September 2017. www.smhi.se. 28 September 2017. sv-SE.
- News: Ett mer än hundraårigt septemberrekord slaget. 29 September 2015. SMHI. Lundgren. Misha. 29 September 2015. sv. 24 June 2016. https://web.archive.org/web/20160624210137/http://www.smhi.se/bloggar/vaderleken/2015/09/29/ett-mer-an-hundraarigt-septemberrekord-slaget/. dead.
- News: Högsta uppmätta lufttryck i Sverige i september. 9 July 2015. SMHI. 23 April 2014. sv.
- News: Högsta uppmätta lufttryck i Sverige i oktober. 9 July 2015. SMHI. 23 April 2014. sv.
- News: Cohen. Nitzan. Mäktigt högtryck ger höstväder. 7 October 2016. blogg.foreca.se. Foreca. sv. 7 October 2016.
- News: Nytt svenskt rekord för högsta lufttryck i oktober. 4 October 2016. SMHI. 4 October 2016. sv.
- News: Högsta uppmätta lufttryck i Sverige i november. 9 July 2015. SMHI. 23 April 2014. sv.
- News: Högsta uppmätta lufttryck i Sverige i december. 9 July 2015. SMHI. 23 April 2014. sv.
- News: Lägsta uppmätta lufttryck i Sverige i januari. 9 July 2015. SMHI. 23 April 2014. sv.
- News: Lägsta uppmätta lufttryck i Sverige i februari. 9 July 2015. SMHI. 23 April 2014. sv.
- News: Lägsta uppmätta lufttryck i Sverige i mars. 9 July 2015. SMHI. 23 April 2014. sv.
- News: Lägsta uppmätta lufttryck i Sverige i april. 9 July 2015. SMHI. 23 April 2014. sv.
- News: Lägsta uppmätta lufttryck i Sverige i maj. 9 July 2015. SMHI. 23 April 2014. sv.
- News: Lägsta uppmätta lufttryck i Sverige i juni. 9 July 2015. SMHI. 23 April 2014. sv.
- News: Lägsta uppmätta lufttryck i Sverige i juli. 9 July 2015. SMHI. 23 April 2014. sv.
- News: Lägsta lufttrycket i juli på över 60 år. 3 July 2020 . www.smhi.se . 2 July 2020.
- News: Lägsta uppmätta lufttryck i Sverige i augusti. 9 July 2015. SMHI. 23 April 2014. sv.
- News: Lägsta uppmätta lufttryck i Sverige i september. 9 July 2015. SMHI. 23 April 2014. sv.
- News: Lägsta uppmätta lufttryck i Sverige i oktober. 9 July 2015. SMHI. 23 April 2014. sv.
- News: Lägsta uppmätta lufttryck i Sverige i november. 9 July 2015. SMHI. 23 April 2014. sv.
- News: Lägsta uppmätta lufttryck i Sverige i december. 9 July 2015. SMHI. 23 April 2014. sv.
- Ilmatieteen laitos http://ilmatieteenlaitos.fi/saaennatyksia
- News: Burt. Christopher C.. World and U.S. Lowest Barometric Pressure Records. 11 June 2015. Weather Underground. 20 November 2011. 21 April 2015. https://web.archive.org/web/20150421230743/http://www.wunderground.com/blog/weatherhistorian/comment.html?entrynum=50. dead.
- News: Uusi matalapaine-ennätys mitattiin Turussa Tulviva merivesi saarsi ruotsinlaivojen terminaalit . 4 July 2020 . Helsingin Sanomat . 28 February 1990 . fi.
- Web site: Õhurõhk . Riigi Ilmateenistus . 16 September 2020 . et.
- News: Air Pressure. 11 June 2015. Estonian Weather Service. 11 June 2015.
- Web site: 20th Century Reanalysis of NOAA, 23 January 1907. wetterzentrale. 11 June 2015. 8 December 2015. https://web.archive.org/web/20151208100630/http://www.wetterzentrale.de/pics/archive/ra/1907/Rrea00119070123.gif. dead.
- News: Tidenes trykk. 30 July 2016. Yr.no. 25 January 2015.
- News: Jaanuari ekstreemumid . 16 September 2020 . ilm.pri.ee . et.
- News: Veebruari ekstreemumid . 16 September 2020 . ilm.pri.ee . et.
- Web site: Märtsi ekstreemumid . ilm.pri.ee . 17 September 2020 . et.
- Web site: Aprilli ekstreemumid . ilm.pri.ee . 17 September 2020 . et.
- News: Mai ekstreemumid . 17 September 2020 . ilm.pri.ee . et.
- News: Juuni ekstreemumid . 17 September 2020 . ilm.pri.ee . et.
- Web site: Juuli ekstreemumid . ilm.pri.ee . 17 September 2020 . et.
- Web site: Augusti ekstreemumid . ilm.pri.ee . 17 September 2020 . et.
- Web site: Septembri ekstreemumid . ilm.pri.ee . 17 September 2020 . et.
- Web site: Oktoobri ekstreemumid . ilm.pri.ee . 17 September 2020 . et.
- Web site: Novembri ekstreemumid . ilm.pri.ee . 17 September 2020 . et.
- Web site: Detsembri ekstreemumid . ilm.pri.ee . 17 September 2020 . et.
- Web site: Gaidāms augstākais atmosfēras spiediens pedējo 3 gadu laikā.. Laika apstākļi Latvijā un citur pasaulē. 23 October 2016. lv. 14 March 2015.
- Burt. Stephen. The Lowest of the Lows … extremes of barometric pressure in the British Isles, part 1 – the deepest depressions. Weather. January 2007. 62. 1. 4–14. 10.1002/wea.20. 2007Wthr...62....4B. 120748945.
- Jersey_Met . 1219243282573807616 . 20 January 2020. What's this 'High Pressure' all about then? .
- News: Paramètres observés, La pression. 29 June 2015. Météo-France. fr. 7 May 2015. https://web.archive.org/web/20150507104537/http://www.meteofrance.fr/prevoir-le-temps/observer-le-temps/parametres-observes/pression. dead.
- meteofrance . 1219309855359500290 . 20 January 2020 . Hautes pressions exceptionnelles. Après 1046,5 hPa déjà relevés ce 19 janv. à Gonneville (Manche), nouveau record aujourd'hui à Abbeville (Somme) avec 1049.7hPa record national, tous mois confondus. .
- News: Anticyclone : nouveau record absolu de pression élevée en France ! . 25 January 2020 . www.meteofrance.fr . 24 January 2020 . fr . 30 January 2020 . https://web.archive.org/web/20200130072816/http://www.meteofrance.fr/actualites/78994717-anticyclone-nouveau-record-absolu-de-pression-elevee-en-france . dead .
- News: La pression atmosphérique. 14 June 2015. Météo-France. fr.
- Book: Cornes. Richard C.. Early Meteorological Data from London and Paris: Extending the North Atlantic Oscillation Series. 2010. Thesis submitted to the University of East Anglia. 87. 9 June 2016.
- Daily Weather Report. Met Office. 28 January 1905. 9 February 2017.
- News: Les chroniques météo de l'année 1905. 29 June 2015. meteo-paris.com.
- News: Bulletin Meteorologique de l'Algerie. 26 August 2015. unknown. 29 January 1905.
- News: TOUMIT . Marie . Météo. Quatre questions sur les records de pression atmosphérique en Bretagne et en Normandie . 31 January 2020 . Ouest-France.fr . 20 January 2020 . fr.
- News: Arrosage francilien, mistral récurrent . 13 May 2019 . www.meteofrance.fr . Météo-France . 13 May 2019 . fr.
- EKMeteo . 1127924300915331075 . 13 May 2019 . EDIT : on me glisse dans l'oreillette que la pression serait montée jusqu'à une valeur record de 1040.7 hPa à #Dunkerque au pas de temps infra-horaire (vers 10h40 locales) ! Exceptionnel pour un mois de mai. #anticyclone . French .
- meteofrance . 1044889851211010048 . 26 September 2018 . L'anticyclone responsable du beau temps actuel est exceptionnellement puissant pour la saison : ce mardi, la pression atmosphérique a atteint un niveau jamais mesuré en France au cours d'un mois de #septembre! . French .
- EKMeteo . 1044967614387286016 . 26 September 2018 . Record national mensuel de pression atmosphérique élevée hier 25-09-2018 à 9h UTC : 1040.0 hPa à Valenciennes (puis 1039.9 hPa à Lille et Le Touquet) #anticyclone Le précédent record pour un mois de septembre en France était de 1038.4 hPa à Dunkerque le 19-09-1986. . French .
- EKMeteo . 1126883001873371137 . 10 May 2019 . Mais on était encore assez loin du record mensuel de basse pression à l'échelle nationale pour un mois de mai, qui est a priori de 980,1 hPa à la Pointe de la Hague (Manche) le 5 mai 2004 (en tout cas record au pas de temps horaire et pour l'époque "moderne"). . French .
- Situations météorologiques particulières: Tempête d'hiver . MET MAR Météorologie maritime . June 1999 . 183 . 20 . fr. 16 October 2020.
- News: IRM - Record de pression battu à Uccle . 21 January 2020 . KMI . 21 January 2020 . fr.
- Web site: Records. Royal Meteorological Institute. IRM. 7 June 2015. 3 July 2015. https://web.archive.org/web/20150703134136/http://www.meteo.be/meteo/view/fr/1103504-Records.html. dead.
- News: Bilan climatologique mensuel mai 2019 . 21 June 2019 . IRM . 1 June 2019 . fr.
- News: Luchtdruk - KMI. 17 November 2016. Weer KMI. Royal Meteorological Institute. nl-BE. 18 November 2016. https://web.archive.org/web/20161118035718/http://www.meteo.be/meteo/view/nl/1103424-Luchtdruk.html. dead.
- News: MeteoLux enregistre deux records de pressions atmosphériques historiques (...) - MeteoLux - Portail Météo Luxembourg . 20 January 2020 . www.meteolux.lu . 20 January 2020 . fr.
- News: MeteoLux enregistre un record de pression atmosphérique en dates du 27 et 28 (...) - MeteoLux - Portail Météo Luxembourg. 4 January 2017. meteolux.lu. MeteoLux. 29 December 2016. fr.
- News: Résumé mensuel du temps pour Janvier 2019 . 25 July 2020 . MeteoLux . January 2019 . fr.
- News: Résumé mensuel du temps pour Février 2020 . 25 July 2020 . MeteoLux . February 2020 . fr.
- News: Résumé mensuel du temps pour Mars 2020 . 25 July 2020 . MeteoLux . March 2020 . fr.
- Web site: Résumé mensuel du temps pour Avril 2020 . MeteoLux . 25 July 2020 . fr.
- News: MeteoLux verzeichnet einen Luftdruckrekord für einen Monat Mai - MeteoLux - Wetterportal Luxemburg . 26 June 2019 . www.meteolux.lu . 4 June 2019 . de.
- Web site: Résumé mensuel du temps pour Juin 2020 . MeteoLux . 25 July 2020 . fr.
- Web site: Résumé mensuel du temps pour Juillet 2019 . MeteoLux . 25 July 2020 . fr.
- Web site: Résumé mensuel du temps pour Août 2019 . MeteoLux . 25 July 2020 . fr.
- News: Deux nouveaux records pour un mois de septembre - MeteoLux - Portail Météo Luxembourg . 20 October 2018 . www.meteolux.lu . 3 October 2018 . fr.
- Web site: Résumé mensuel du temps pour Octobre 2019 . MeteoLux . 25 July 2020 . fr.
- Web site: Résumé mensuel du temps pour Novembre 2019 . MeteoLux . 25 July 2020 . fr.
- Web site: Resume Mensuel du Temps de Decembre 2015 . Meteolux . 25 July 2020.
- Web site: Résumé mensuel du temps pour Janvier 2020 . MeteoLux . 25 July 2020 . fr.
- Web site: Résumé mensuel du temps pour Mai 2020 . MeteoLux . 25 July 2020 . fr.
- Web site: Résumé mensuel du temps pour Septembre 2019 . MeteoLux . 25 July 2020 . fr.
- Web site: Résumé mensuel du temps pour Décembre 2019 . MeteoLux . 25 July 2020 . fr.
- News: de Haij. Marijn. Automatische validatie van druk- en windwaarnemingen op het KNMI - een verkenning. 1 December 2015. KNMI internal report = intern rapport; IR 2009 - 03. KMNI. 1 March 2009.
- Web site: KNMI - Luchtdruk. www.knmi.nl. 4 December 2016. nl.
- Web site: Jaarrecords van het weer van alle KNMI stations in Nederland. weergegevens.nl. 8 October 2016. https://web.archive.org/web/20161010224131/http://weergegevens.nl/extremes_y.aspx. 10 October 2016. dead.
- Web site: Maandrecords van het weer van KNMI stations in Nederland - De records van all stations van . www.wetterzentrale.de . 24 September 2020.
- News: KNMI - Uitzonderlijk hoge luchtdruk in Nederland . 20 January 2020 . www.knmi.nl . 20 January 2020 . NL.
- Web site: Maandrecords van het weer van KNMI stations in Nederland - De records van all stations van . www.wetterzentrale.de . 24 September 2020.
- Web site: Record de pression atmosphérique à De Bilt (Pays-Bas). geoclimat.org. KNMI via geoclimat.org. 19 August 2017. fr.
- News: Maart 2003: hoogste luchtdruk in maart. 1 December 2015. KMNI. 17 March 2003. nl.
- Web site: Maandrecords van het weer van KNMI stations in Nederland - De records van all stations van . www.wetterzentrale.de . 24 September 2020.
- Web site: Maandrecords van het weer van KNMI stations in Nederland - De records van all stations van . www.wetterzentrale.de . 24 September 2020.
- Web site: Maandrecords van het weer van KNMI stations in Nederland - De records van all stations van . www.wetterzentrale.de . 24 September 2020.
- Web site: Maandrecords van het weer van KNMI stations in Nederland - De records van all stations van . www.wetterzentrale.de . 24 September 2020.
- Web site: Maandrecords van het weer van KNMI stations in Nederland - De records van all stations van . www.wetterzentrale.de . 24 September 2020.
- Web site: Maandrecords van het weer van KNMI stations in Nederland - De records van all stations van . www.wetterzentrale.de . 24 September 2020.
- Web site: Maandrecords van het weer van KNMI stations in Nederland - De records van all stations van . www.wetterzentrale.de . 24 September 2020.
- Web site: Maandrecords van het weer van KNMI stations in Nederland - De records van all stations van . www.wetterzentrale.de . 24 September 2020.
- Web site: Maandrecords van het weer van KNMI stations in Nederland - De records van all stations van . www.wetterzentrale.de . 24 September 2020.
- News: Uitzonderlijk lage barometerstanden. 24 April 2016. knmi.nl. KMNI. nl.
- News: Luchtdrukrecord voor mei 2000. 24 April 2016. knmi.nl. KMNI. nl.
- News: Twee zomerstormen in één week. 8 October 2016. wap.knmi.nl. KMNI. 23 July 2007. nl. 12 October 2016. https://web.archive.org/web/20161012103803/http://wap.knmi.nl/over-het-knmi/nieuws/twee-zomerstormen-in-een-week. dead.
- Web site: Wetter und Klima - Deutscher Wetterdienst - Startseite. www.dwd.de.
- News: Thema des Tages - Wetterextreme in Deutschland und weltweit. 19 February 2017. www.dwd.de. DWD. 16 February 2017. de.
- News: Extremwetterereignisse Wetterrekorde in Mitteleuropa. 11 June 2015. Welt der Synoptik. 11 June 2015. 2 December 2014. https://web.archive.org/web/20141202032918/http://www.synoptische-meteorologie.de/extras/wetterrekorde-europa/wetterrekorde-mitteleuropa/. dead.
- Web site: Wetterrekorde Deutschland und Weltweit. wetterprognose-wettervorhersage.de. 26 August 2015.
- Web site: Wetterzentrale Forum :: Allgemeine Meteorologie :: Die Rekorde für Deuschland sind beide falsch. www.wzforum.de.
- Web site: Climate Data Center . cdc.dwd.de . Deutscher Wetterdienst . 15 June 2020.
- DWD_presse . 1505122114642321408 . Heute Morgen vor allem in Schleswig-Holstein zahlreiche Allzeitrekorde beim Luftdruck! Spitzenreiter bisher: Kiel Leuchtturm 1049,5 hPa Leck 1049,4 hPa List 1049,4 hPa Schönhagen 1049,1 hPa.
- News: Meteorologische Mittel- und Extremwerte von Berlin-Dahlem . 15 June 2020 . www.met.fu-berlin.de . 2 November 2019 . https://web.archive.org/web/20191102091241/http://www.met.fu-berlin.de/~manfred/extrema.htm . dead .
- Web site: emulate/landstation_mslp/corrected . . 6 July 2020.
- News: Extrem hoher Luftdruck derzeit in Österreich - Wetter . 31 January 2020 . Heute.at . 20 January 2020 . de.
- News: Tlak vzduchu klesl nezvykle nízko, překonal i absolutní rekord. Meteopress. cs. 26 October 2021. 12 January 2024.
- Web site: Meteorologický slovník . slovnik.cmes.cz . 21 January 2020 . cs.
- News: Éghajlat PAGE. 5 August 2016. owww.met.hu. Országos Meteorológiai Szolgálat. hu.
- Web site: L'andamento del clima a Torino dal Settecento a oggi . Dati Meteo Asti . 14 May 2020 . it-IT.
- Book: Mercalli . Luca . Di Napoli . Gennaro . Il clima di Torino . 2008 . Società Meteorologica Subalpina . 978-8890302343 . it.
- News: Rossi. Marco. Record di pressione a confronto: 5 marzo 2009 nella "top five" dell'ultimo secolo. 13 June 2015. Meteogiornale. 6 March 2009. it.
- News: Vortice Polare prossimo all'Italia: pressione atmosferica di tempesta. Picco da record - Ricerca meteo su clima rigido. https://web.archive.org/web/20160909092234/https://www.freddofili.it/8677-vortice-polare-pressione-atmosferica-picco-record/. dead. 9 September 2016. 2 December 2017. www.freddofili.it. 28 January 2015.
- News: Rekordhoher Luftdruck!. 7 February 2017. Vaterland online. de.
- News: W poniedziałek Polska w zasięgu REKORDOWO silnego wyżu. . 21 January 2020 . IMGW-PIB . 18 January 2020 . pl.
- News: BARDZO NISKIE CIŚNIENIE W ZAKOPANEM - Rekord Polski Pobity!. 26 August 2015. tatromaniak.pl/. 30 January 2015. pl.
- News: Michaś przyniósł najniższe ciśnienie nawet od 26 lat. 26 August 2015. twojapogoda.pl. 31 January 2015. pl. 10 May 2015. https://web.archive.org/web/20150510053619/http://www.twojapogoda.pl/wiadomosci/114524,michas-przyniosl-najnizsze-cisnienie-nawet-od-26-lat. dead.
- News: Výberči. Dalibor. Faško. Pavol. Pecho. Jozef. Bochníček. Oliver. Csörgei. Tibor. Babin. Ľubomír. O extrémoch redukovaného tlaku vzduchu na Slovensku: najvyššie hodnoty . 22 May 2020 . Meteorologické zprávy. 73. 2. 39–45. Czech Hydrometeorological Institute . April 2020 . sk.
- News: Aké je absolútne slovenské maximum redukovaného tlaku vzduchu? . 15 April 2020 . Slovak Hydrometeorological Institute . 15 April 2020 . sk.
- News: Slovak Hydrometeorological Institute . Klimatický atlas Slovenska [Climate Atlas of Slovakia] . 978-80-88907-90-9 . 2015.
- meteoSI . 1219567815226642432 . 21 January 2020 . Pri nas so bile vrednosti okrog 1048 hPa. Še malo višje vrednosti so bile izmerjene 24. 12. 1963 in 24. 1. 1907. . sl.
- Šter . Blaž . vremenolovec . 1219324734678192129 . 20 January 2020 . Slovenian. Čas za umerjanje višinomera. Zračni tlak je neobičajno visok, okrog 1047 hPa (reduciran na morski nivo). Rekordna vrednost je ~1050 hPa. Npr. v Ljubljani je zračni tlak takšen, kot poleti v Portorožu..
- News: Über der Inversion mild und knochentrocken. 27 December 2016. www.meteoschweiz.admin.ch. MeteoSchweiz. 10 December 2015. de.
- News: Kalte Füsse! - MeteoSchweiz . 20 January 2020 . www.meteoschweiz.admin.ch . 20 January 2020 . de.
- Web site: 20161228 01 Pressure – Schweizer Sturmarchiv. www.sturmarchiv.ch. 22 November 2017. de.
- News: Luftdruck in Zürich in Rekordhöhe. 22 November 2017. www.meteoschweiz.admin.ch. 28 December 2016. de.
- News: Zogg. Jürg. Hammerhoch in der Altjahrswoche. 27 December 2016. Schweizer Radio und Fernsehen (SRF). 26 December 2016. de.
- News: Hoch Yörn bringt Luftdruck wie seit Jahren nicht mehr. 27 December 2016. Der Bund. 27 December 2016. de.
- Web site: Schweizer Sturmforum • Thema anzeigen - Schweiz Wetter : Extreme & Rekorde. www.sturmforum.ch. 8 August 2016. de.
- News: High Pressure Dominated Middle Of January 1882. Netweather Community Forums.
- Annals 1882 . Annals of the Swiss Meteorological Central Institute . 1882 . 27 February 2020.
- News: POPADIĆ . RADE . Ekstremne-Vrijednosti velikom dijelu zemlje upravo se bilježi najviši tlak zraka u znanoj povijesti: Moguća izražena oseka DALMACIJA DANAS - obala, otoci, Zagora. Najnovije vijesti iz Dalmacije. . 21 January 2020 . Dalmacija Danas . 21 January 2020 . hr.
- DHMZ_HR . 1219529538918547456 . 21 January 2020 . Dobro jutro! Ako ste se danas teško digli iz nemojte se čuditi ipak nas tlači više od 1045 hPa što je neubičajeno. Tako je u Kutjevu izmjeren tlak od 1050, Daruvaru 1049, Osijeku 1048 i Zagreb 1047 hPa. . Hr.
- Daily Weather Report . Meteorological Report for the Year 1907. Issued by the Survey Department, Cairo . 11 July 2020.
- News: Το Βαρομετρικό Χαμηλό και ο Αντικυκλώνας – Hellenic Weather . 20 September 2020 . hellenicweather.com . 18 July 2019 . el.
- Book: Papadopoulos . Anastasios . Varlas . George . The Aegean Sea Environment . Weather Systems Affecting the Meteorological Conditions over the Aegean Sea . The Handbook of Environmental Chemistry . 2020 . 127 . 141–165 . 10.1007/698_2020_657. 978-3-031-53796-7 . 226473384 .
- News: Records provisionales de altas presiones batidos el 9 de enero de 2015. 1 December 2015. tiempo.com. 11 January 2015.
- News: Presión récord en muchos lugares de España en enero. 1 December 2015. Levante. 27 January 2015. es.
- News: Los 12 fenómenos naturales y meteorológicos del año. 10 August 2016. Noticias de El tiempo. 29 December 2015.
- (España) . Boletín del Domingo 29 de Enero do 1905 . Boletín meteorológico diario (1893-2007) . 29 January 1905 . 20.500.11765/6290 . 22 July 2020 . es.
- Rubio. José Miguel Viñas. Los temporales de viento en la Península Ibérica Análisis meteorológico de la extraordinaria situación atmosférica de febrero de 1941. Gerencia de Riesgos y Seguros (Fundación MAPFRE). 2001. 74. 1 December 2015.
- News: AVANCE CLIMATOLÓGICO MENSUALENERO DE 2015 EN ILLES BALEARS. 14 June 2015. AEMET. es.
- News: Portugal registou extremo absoluto da pressão atmosférica no dia 9. 12 June 2015. Por Sul Informação. 14 January 2015.
- News: Salvado. Sandra. Piteira. Sara. Pressão atmosférica provoca cefaleias e mudanças de humor. 12 June 2015. RTP. 15 January 2015.
- Janeiro de 2015. Boletim Climatológico Mensal. 14 June 2015. 2183-1076.
- Taborda. João Paulo. O temporal de 3 a 6 de Dezembro de 1739 em Portugal - reconstituição a partir de fontes documentais descritivas. Finisterra. 2006. XLI. 82. 73–86. 27 July 2016. pt.
- News: IPMA - Detalhe noticia: CICLONE DE 1941. 29 December 2019. IPMA. 16 February 2017. pt.
- de Freitas. Joana Gaspar. Dias. João Alveirinho. 1941 windstorm effects on the Portuguese Coast. What lessons for the future?. Journal of Coastal Research. 2 January 2013. 65. 714–719. 10.2112/SI65-121. 129952992.
- Muir-Wood. Robert. The 1941 February 15th Windstorm in the Iberian Peninsula. Trébol. 2011. 56. 4–13. 27 July 2016.
- Garnier . E. . Ciavola . P. . Spencer . T. . Ferreira . O. . Armaroli . C. . McIvor . A. . Historical analysis of storm events: Case studies in France, England, Portugal and Italy . Coastal Engineering . April 2018 . 134 . 10–23 . 10.1016/j.coastaleng.2017.06.014. 11392/2382846 . 135031862 . free .
- Economou. Theodoros. Stephenson. David B.. Ferro. Christopher A. T.. Spatio-temporal modelling of extreme storms. The Annals of Applied Statistics. December 2014. 8. 4. 2223–2246. 10.1214/14-AOAS766. 1501.06377. 28268034.
- Burt. Stephen. Another new North Atlantic low pressure record. Weather. April 1993. 48. 4. 98–103. 10.1002/j.1477-8696.1993.tb05854.x. 1993Wthr...48...98B.
- Burt. S. D.. A New North Atlantic Low Pressure Record. Weather. February 1987. 42. 2. 53–56. 10.1002/j.1477-8696.1987.tb06919.x. 16 August 2015. 1987Wthr...42...53B.
- Web site: Richard J. Pasch . Eric S. Blake . Hugh D. Cobb III . David P. Roberts . [{{NHC TCR url|id=AL252005_Wilma}} Hurricane Wilma Tropical Cyclone Report]. January 12, 2006. National Hurricane Center. April 20, 2016.
- News: Cassardo. Claudio. Very low minima of extratropical cyclones in North Atlantic. 18 June 2016. 23 January 2013.
- Lin . Peiyi . Zhong . Rui . Yang . Qinghua . Clem . Kyle R. . Chen . Dake . A Record-Breaking Cyclone Over the Southern Ocean in 2022 . Geophysical Research Letters . 28 July 2023 . 50 . 14 . 10.1029/2023GL104012. 2023GeoRL..5004012L . free.
- Web site: Marine Weather Warning for GMDSS Metarea XI 2014-11-08T06:00:00Z. WIS Portal – GISC Tokyo. Japan Meteorological Agency. November 8, 2014.
- News: Halverson. Jeff. Bering Sea 'bomb' cyclone ties record for strongest winter storm in North Pacific. 18 June 2016. The Washington Post. 14 December 2015.
- News: Kells. James. December 2015 North Pacific Hurricane Force Low. 18 June 2016. NOAA. 27 April 2016.
- NWSOPC . 1344777762586861569 . 31 December 2020 . Here is the surface analysis from 18 UTC. The strong low pressure center remains at 921 mb and continues to produce #hurricaneforce winds to 85 kts! The image also shows the warning received by mariners at sea. Waves up to 60 ft are expected..
- News: Samenow . Jason . Freedman . Andrew . Bomb cyclone in northern Pacific Ocean breaks all-time records . 1 January 2021 . Washington Post . 31 December 2020.
- Burt. Stephen. Britain's lowest barometric pressure since 1886. Weather. March 2014. 69. 3. 79–81. 10.1002/wea.2285. 2014Wthr...69...79B. free.
- Book: Lamb. H.H.. Climate, history and the modern world. 2002. Routledge. London. 978-1-134-79838-4. 390. 2..
- Burt. Stephen. Barometric pressure during the Irish storm of 6–7 January 1839. Weather. 1 January 2006. 61. 1. 22–27. 10.1256/wea.53.05. 2006Wthr...61...22B. 122580558.
- Sweeney. John. A three-century storm climatology for Dublin 1715–2000. Irish Geography. January 2000. 33. 1. 1–14. 10.1080/00750770009478595.
- News: Jónsson . Trausti . Af árinu 1852 . 22 October 2020 . trj.blog.is . Is.
- Web site: Stasjon Mike. Geophysics Institute, University of Bergen. 11 June 2016. no. dead. https://web.archive.org/web/20160805085700/http://web.gfi.uib.no/forskning/mike/meteorologi.html. 5 August 2016.
- News: Jónsson . Trausti . Af árinu 1888 . 4 September 2018 . trj.blog.is . 30 August 2018 . is.
- News: Lägsta uppmätta lufttryck i Sverige i december. 10 June 2016. www.smhi.se. 23 April 2014. sv.
- News: Danmarks laveste lufttryk fylder 100 år: DMI. 18 May 2016. dmi.dk. 5 April 2016. https://web.archive.org/web/20160405180716/http://www.dmi.dk/nyheder/arkiv/nyheder-2007/danmarks-laveste-lufttryk-fylder-100-aar/. dead.
- News: Jonsson . Trausti . Af árinu 1924 . 20 August 2018 . trj.blog.is . 15 August 2018 . is.
- Web site: Jónsson . Trausti . Halaveðrið . trj.blog.is . 9 December 2019.
- Web site: Extratropical low pressure (atm401, spring 2015 events NH extreme ETC). Albany.edu. 30 May 2016.
- Web site: Jónsson . Trausti . Hugsað til ársins 1948 - trj.blog.is . trj.blog.is . 15 June 2022.
- Tryggvason. E. Rapid pressure variations in Iceland. Monthly Weather Review. 1960. 88. 256. 10.1175/1520-0493(1960)088<0256:WNRPVI>2.0.CO;2. 5 May 2016. 3 March 2017. https://web.archive.org/web/20170303105706/https://docs.lib.noaa.gov/rescue/mwr/088/mwr-088-07-0256.pdf. dead.
- Brown. Paul R.. The depths of the North Atlantic depressions. Journal of Meteorology. October 1995. 21. 202. 13 January 2017.
- News: Storms of January 1974. 9 June 2016. Met Éireann. May 1974. https://web.archive.org/web/20160303232933/http://www.met.ie/climate-ireland/weather-events/Jan1974_Storm.PDF. 3 March 2016. dead.
- Daily Weather Report. 8 February 1982. 6 February 2017. Met Office.
- Book: Horisont årsbok 1982. 1983. Bertmarks förlag. sv.
- Web site: Jónsson. Trausti. An unusually low pressure recorded in Iceland. Iceland weather blog. 1 June 2016. 31 December 2015.
- Web site: Great weather events: A record-breaking Atlantic weather system . Met Office . 29 May 2016 . 11 August 2004 . unfit . https://web.archive.org/web/20040811204048/http://www.metoffice.gov.uk/corporate/pressoffice/anniversary/recordlow1986.html . August 11, 2004 .
- News: Masters. Jeff. Mighty North Atlantic low bombs to 930 mb Dr. Jeff Masters' WunderBlog. 30 May 2016. www.wunderground.com. Wunderblog. 26 January 2013. 25 June 2016. https://web.archive.org/web/20160625104743/https://www.wunderground.com/blog/JeffMasters/mighty-north-atlantic-low-bombs-to-930-mb. dead.
- News: Masters. Jeff. Flying into a record Nor'easter. 3 January 2018. Wunderblog. 15 February 2006.
- Web site: Polarfronts hjemmesider. Misje Rederi AS. www.misje.no. no. 2016-06-19. 2017-04-06. https://web.archive.org/web/20170406135311/http://www.misje.no/polarfront/oppgaver.htm. dead.
- mikarantane . 1318850243790864384 . 21 October 2020 . Quick plot on minimum sea level pressure in the North Atlantic in the month of October in 1979-2019. The deepest storm seems to be a 921 hPa cyclone on 29-30 October 1989. .
- WorldClimateService . 1050814054367932418 . 12 October 2018 . The October CFSR record is 926mb from 29 Oct 1989. Interesting that 2018 just displaced 1989 in terms of record positive 12-month running average NAO index (CPC data)..
- News: Daily Weather Summary. 13 January 2018. Met Office.
- SimonLeeWx . 1588721991145508864 . Out of interest, the lowest pressure in this domain in 1959-2021 is 931.5 hPa at 06Z on 29 November 1992..
- Web site: Record low over the Atlantic. oiswww.eumetsat.org. 29 May 2016.
- Odell. Luke. Knippertz. Peter. Pickering. Steven. Parkes. Ben. Roberts. Alexander. The Braer storm revisited. Weather. April 2013. 68. 4. 105–111. 10.1002/wea.2097. 2013Wthr...68..105O. 120025537.
- McCallum. E.. Grahame. N. S.. The Braer storm - 10 January 1993. Weather. April 1993. 48. 4. 103–107. 10.1002/j.1477-8696.1993.tb05855.x. 1993Wthr...48..103M.
- George P.. Bancroft. Marine Weather Review North Atlantic Area December 1998 through March 1999. Mariners Weather Log. August 1999. 42. 2. 30 May 2016.
- Web site: MSLP Analysis Met Office Fax 16 January 1999. 29 May 2016.
- Web site: Sävert. Thomas. Winterstürme in Europa - Thomas Sävert Naturgewalten. www.naturgefahren.de. 29 May 2016. de.
- News: Mariners Weather Log. 44. 25 February 2017. 1. NOAA. April 2000.
- Brown. Paul R.. A brief note on the intense depressions of late December 1999 over Western Europe. Journal of Meteorology. February 2000. 25. 13 January 2017.
- News: Tiefdruckgebiet GORDIAN (getauft am 10.03.2003). 22 July 2016. www.met.fu-berlin.de. Free University of Berlin. de.
- Bancroft. George P.. MARINE WEATHER REVIEW - North Atlantic Area March to August 2003. Mariners Weather Log. December 2003. 47. 20 April 2016.
- News: Das Tiefdruckgebiet Xynthia. 22 July 2016. www.met.fu-berlin.de. de.
- Mariners Weather Log Vol. 51, No. 1, April 2007. www.vos.noaa.gov. 29 May 2016.
- News: Bancroft . George P. . Marine Weather Review—North Atlantic Area September through December 2007 Mariners Weather Log Vol. 52, No. 1, April 2008 . 28 June 2019 . vos.noaa.gov . April 2008.
- Web site: Analysis 23 01 2009. Free University Berlin. 2 February 2017. 4 March 2016. https://web.archive.org/web/20160304031234/http://www.met.fu-berlin.de/de/wetter/maps/Analyse_20090123.gif. dead.
- Web site: Depressie - KMI. Weer KMI. KMI. 2 February 2017. nl-BE.
- Web site: Analysis 11 February 2011. Free University of Berlin. 8 February 2017.
- Web site: Wiese. Heiko. Tiefdruckgebiet Paolini. www.met.fu-berlin.de. 8 February 2017.
- Marine Weather Review – North Atlantic Area January. through June 2011. Mariners Weather Log. December 2011. 55. 3. 8 February 2017. NOAA.
- News: Low-pressure area. 25 April 2016. blog.metoffice.gov.uk. Met Office News Blog.
- News: Masters. Jeff. Mighty North Atlantic low bombs to 930 mb Dr. Jeff Masters' WunderBlog. 25 April 2016. www.wunderground.com. Wunderground. 25 June 2016. https://web.archive.org/web/20160625104743/https://www.wunderground.com/blog/JeffMasters/mighty-north-atlantic-low-bombs-to-930-mb. dead.
- Web site: Tiefdruckgebiet JOLLE. www.met.fu-berlin.de. 25 April 2016.
- News: Dramatiskt julväder i Sverige och övriga Europa. 7 January 2014. Swedish Meteorological and Hydrological Institute. 27 December 2013. sv. 7 January 2014. https://web.archive.org/web/20140107121945/http://www.smhi.se/nyhetsarkiv/dramatiskt-julvader-i-sverige-och-ovriga-europa-1.35142. dead.
- Web site: Analysis 24/12/2013. NOAA. 9 February 2014. https://archive.today/20140209143747/http://nomads.ncdc.noaa.gov/ncep-charts/hires/20131224/gdas.sfc.mslp.thk.nh.anl.12.20131224.gif. 9 February 2014. dead.
- News: Winter storms, December 2013 to January 2014. 14 February 2014. Met Office. 12 February 2014.
- Web site: Ocean Prediction Center. NOAA. 2015. 30 December 2015. East Atlantic Surface Analysis 00Z 5 December 2015.
- News: Zogg. Jürg. Rekord-Hoch über der Schweiz, Orkantief über Island. Schweizer Radio und Fernsehen (SRF). 8 December 2015. de.
- Web site: Ocean Prediction Center. NOAA. 2015. 5 January 2016. East Atlantic Surface Analysis 06Z 30 December 2015.
- News: Storm Frank over the Northeast Atlantic Ocean « CIMSS Satellite Blog. 20 January 2018. cimss.ssec.wisc.edu. 30 December 2015.
- News: Jonsson. Trausti. Köld stroka að vestan - trj.blog.is. 6 September 2017. trj.blog.is. 21 December 2016. is.
- Bancroft. George P.. Marine Weather Review – North Atlantic Area September to December 2016. Mariners Weather Log. August 2017. 61. 2. 6 September 2017.
- Web site: Analysis 6 February 2017. Free University Berlin. 6 February 2017.
- Web site: 00 UTC 6 February 2017. Met Office. 20 January 2018.
- Maue . Ryan . RyanMaue . 828623188783427584 . 6 February 2017 . Lowest pressure was 932 mb according to @NWSOPC at 06z.. 6 February 2017.
- Reinhart . Brad . BradReinhart . 950476376964063235 . 8 January 2018 . Do you know how many hurricane force lows @NWSOPC deals with every year in the Atlantic? Come by poster #379 this afternoon to find out and learn more! #AMS2018. 10 January 2018.
- dmidk . 828531862431735808 . 6 February 2017. Dybt lavtryk i Nordatlanten på ca. 935hPa holder sig fra Rigsfællesskabet, hvor #Færøerne har rekorden for laveste lufttryk på 930,3hPa.. Danish.
- Bancroft. George P.. North Atlantic Area (January to April 2017). Mariners Weather Log. December 2017. 61. 3. 1 February 2018. 0025-3367.
- Web site: Chart 25 Feb 2017. Adopt a Vortex, Free University of Berlin. www.met.fu-berlin.de. 1 February 2018.
- Web site: UKMO analysis chart 25 Jan 2017. wetter3.de archive. UKMO. 1 February 2018.
- Web site: Analysis 15 January 2018. Free University Berlin. 20 January 2018.
- Web site: 1800 UTC 14 Jan 2018 Analysis chart. Met Office. 20 January 2018.
- News: Analysis 12 October 2018 . 13 October 2018 . Free University Berlin.
- Web site: 18101200 UKMet Analysis . archived by www.wetter3.de . Met Office . 13 October 2018.
- News: Forecaster's Commentary -Storm Callum . https://web.archive.org/web/20181012130222/https://www.met.ie/forecasters-commentary . dead . 12 October 2018 . 13 October 2018 . Met Éireann . 12 October 2018.
- News: Weather Summary for October 2018 . 2 November 2018 . Met Éireann . 2 November 2018.
- Web site: UKMO analysis chart 18 UTC 20 Feb 2019 . www1.wetter3.de . UKMO . 21 February 2019.
- News: Collins . Timothy . Story Map Series: 2018/19 North Atlantic Hurricane Force (HF) Wind Events . 28 June 2019 . ICYMI OPC . May 2019.
- Web site: Analysis 7 February 2020. Adopt a Vortex . 8 February 2020.
- News: Dolan . Deidre . Bombs Away! The North Atlantic's Cyclogenesis Frenzy, February 5-15, 2020 . 9 March 2020 . Satellite Liaison Blog . 6 March 2020.
- NWSOPC . 1225917997610500097 . 7 February 2020 . A strong storm in the North Atlantic has reach 930 mb and is producing #hurricaneforce winds. .
- News: North Atlantic Storminess – February 13-15, 2020 . 16 February 2020 . Satellite Liaison Blog . NWS . 16 February 2020 . en.
- News: Schappert . Sebastian . Thema des Tages - "VICTORIA" rekordverdächtig? . 9 March 2020 . www.dwd.de . 17 February 2020 . de.
- News: Jónsson . Trausti . Smáviðbætur varðandi veðrið í gær - trj.blog.is . 16 February 2020 . trj.blog.is . 15 February 2020 . is.
- RyanMaue . 1229129327222181888 . 16 February 2020. Final analyzed pressure of powerful North Atlantic #StormDennis was 919 mb from ECMWF 00z. .
- JimCantore . 1339147343174758400 . 16 December 2020. Sub 940mb it is!! @NWSOPC.
- NWSOPC . 1478288318622146560 . The OPC 48-hour surface forecast shows an intense 928 mb low developing to the SE of Greenland with winds increasing to 80 kt....
- Web site: Tiefdruckparade . www.meteoschweiz.admin.ch . MeteoSchweiz . 6 January 2022 . German.
- Web site: http://www.met.fu-berlin.de/de/wetter/maps/anabwkna.gif . 7 February 2022.
- Web site: Jónsson . Trausti . Fáeinir punktar um illviðrið - trj.blog.is . trj.blog.is . 7 February 2022 . is.
- News: Strongest low on Earth last weekend was a record-breaker in Canada . 15 March 2022 . ca.news.yahoo.com . en-CA.
- Vejrkonsulenten . 1503276448395804673 . Hvis målingen på 935,7 hPa består en kvalitetskontrol, er det ny rekord for det laveste målte lufttryk på #Grønland. Grafik lavet med DMI NINJO..
- SimonLeeWx . 1588721984334356480 . Per UKMO analyses, Post-Tropical Cyclone Martin reached a minimum SLP of 934 hPa at 06Z on Friday (Nov 4)..

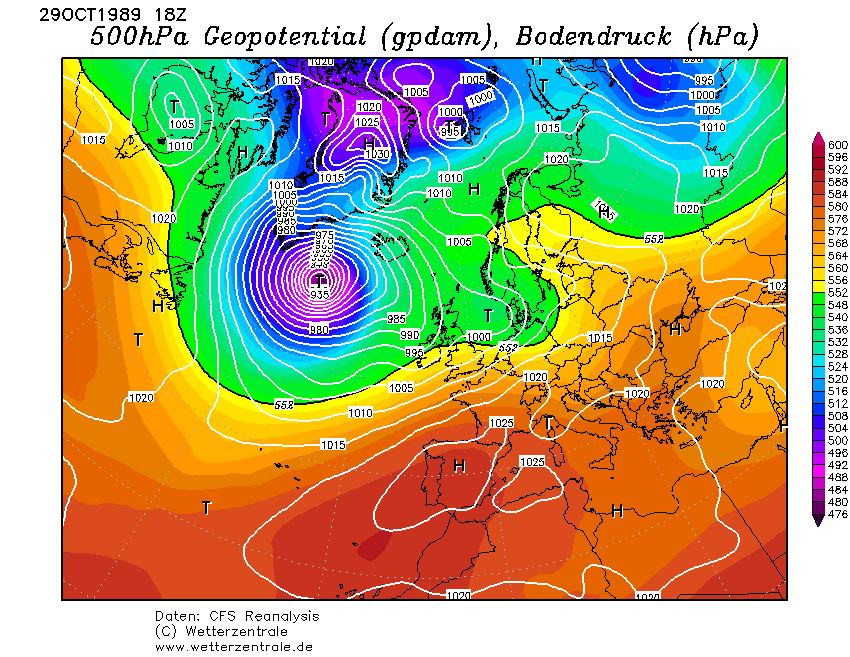
_20_February_2019.png)